Normality test for small samples with power comparison
-
$\begingroup$ This is a vague question: please indicate what specific kind of help you are looking for. $\endgroup$– whuber ♦Commented Dec 30, 2013 at 5:17
-
1$\begingroup$ (1) I've only heard of a Ryan test in the context of multiple comparisons. I'm familiar with many dozens (perhaps as many as a hundred) of goodness of fit tests, and a Ryan test for normality is new to me. Can you describe the test? (2) When looking at power for goodness of fit (or indeed any test whose alternative is not indexed by only one or at most a few parameters), you must specify against which alternatives power is being calculated. $\endgroup$– Glen_bCommented Dec 30, 2013 at 5:33
-
$\begingroup$ To be more explicit: You should edit your post to clarify these issues and what you seek to know. $\endgroup$– Glen_bCommented Dec 30, 2013 at 7:18
-
$\begingroup$ ...and probably consider related issues too! (e.g., stats.stackexchange.com/q/2492/32036) $\endgroup$– Nick StaunerCommented Dec 30, 2013 at 9:51
-
$\begingroup$ In the context of goodness of fit, it occurs to me that you might intend the Ryan-Joiner test (discussed here). Is that the case? $\endgroup$– Glen_bCommented Aug 17, 2018 at 13:26
1 Answer
Goodness of fit tests generally have very broad alternatives. For example, when testing normality, the alternative is usually "anything but normality". To compute the power you need to specify a particular alternative.
Small sample power against a specific alternative can sometimes be calculated algebraically, but the usual approach - one that is both simple and general - is to simulate to obtain the rejection rate.
So, for example, if we want to compute the power of the Shapiro-Wilk test for normality at the exponential distribution, for samples of size 20, then we would carry out the following steps:
repeat nsim times:
   generate an exponential sample of size 20
   compute the Shapiro-Wilk statistic, W
   if (W <= Wcrit) increment the count of rejections
rejectrate = rejections/nsim
You can easily compute an interval for the power (since the sample rejection rate is scaled binomial).
Here's this approach rendered in R (and slightly generalized):
nsim = 1000; alpha = 0.05; n = 20
power = mean(replicate(nsim,(shapiro.test(rexp(n))$p.value<alpha)))
Running that second line several times, I get estimated power of 0.807, 0.823, 0.843. It's a simple matter to change the distribution in that code (or even to write a function and pass in a function to simulate the distribution).
Normally I'd use a larger simulation size. With 100,000 simulations the power in the above example is $0.83402 \pm 0.00231$ (95% interval for the rejection rate).
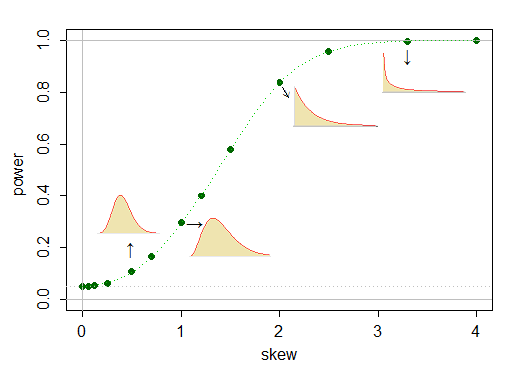
If you're considering a family of alternatives indexed by a parameter (e.g. the gamma family, indexed by the shape parameter; the scale is irrelevant because the Shapiro Wilk isn't affected by scale), you can plot a power "curve" against the parameter for a number of values (indeed, you could smooth across the calculated rejection rates with a smoothing technique appropriate to binomial proportions and obtain an estimated power curve); alternatively, you could plot against some meaningful function of the parameter (in the case of the gamma, plotting against the skewness coefficient makes a lot of sense, and conveniently places the null at zero rather than infinity).
Here's such a power curve against the gamma family at n=20, alpha=0.05, with nsim of 50000 at each point, with a fairly smooth interpolation (rather than smoothing, since at that sample size the largest standard error is only about half a pixel).

If you're considering power against a fixed alternative but across sample sizes or significance level, again you can obtain a kind of power curve (but against $n$ or the level in this case).
If you consider power against distributions indexed by two shape-related parameters (the Pearson family, for example), or against one shape-parameter and sample size, you will have a power surface or a family of power curves.
If you're just considering a number of unrelated alternatives, generally speaking a table is the most appropriate way to present the information.
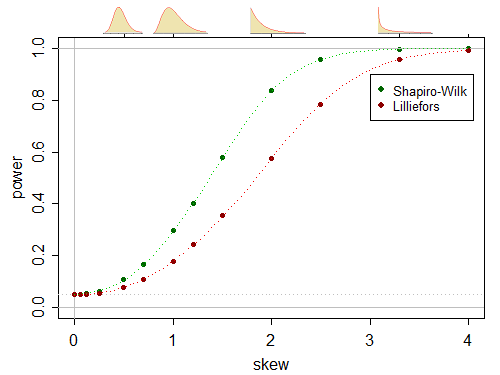
When comparing two tests, you can display both on the same plot or in the same table; standard errors should make it easier to see when the differences are more than can be accounted for by random variation (on the other hand, if the power difference is pretty small, it doesn't much matter if you can't tell which is better, because you'd lose little by using the one with lower power).

The Shapiro-Wilk has substantially better power in this case.
(In this case, marking standard error bars is useless, because they would lie inside the spots marking the points and wouldn't be seen.)
-
$\begingroup$ +1, this is awesome. (I was going to do +6, but maybe the fact that the question is closed prevents that.) How did you make the top figure? $\endgroup$ Commented Jan 7, 2014 at 5:03
-
$\begingroup$ @gung Well, plotting the points is simple. The curve came from transforming both variables to achieve near-linearity and fitting a cubic spline but upon realizing I was doing more than required, I simply linearly interpolated the fitted values and transformed back. I could have just interpolated the observed values and you wouldn't see any difference (indeed that's what I implied I did in my answer). ...(ctd) $\endgroup$– Glen_bCommented Jan 7, 2014 at 7:32
-
$\begingroup$ @gung (ctd)... The densities and arrows I had planned to do via passing
dgammaresults topolygonand callingarrowsto point to them... but time was short, so I cheated and just generated some densities, resized them and pasted them in, via Paint. If I needed to do it again, I'd usepolygonandarrowsthough. (Oh, I should have mentioned, the linear interpolation was viaapprox) $\endgroup$– Glen_bCommented Jan 7, 2014 at 7:34 -
$\begingroup$ @Glen_b Thank you for a great answer! As far as I understood, in all surveys that evaluate statistical power of normality tests, authors use some predefined set of alternative distributions to test against. I belive similar thing happens with nonparametric test, such as KS test - people define parametric families they are interested in and then test against very distinct distributions from them. I wonder why people not consider for each sample size n an integral of function error2(statistical distance) - dependency between type 2 error (not rejecting wrong null hyposesis) for this sample size $\endgroup$– MInnerCommented Aug 10, 2018 at 7:51
-
$\begingroup$ ... for this sample size as underlying distributions become further in terms of some statistical distance like JSD or KS. Similarly to they way ROC curves are compared by their AUC values for different values of n. That would make more sense to me - we estimate how sensitive is the test to small and large differences in distribution CDFs. Does anyone do that? Thank you! $\endgroup$– MInnerCommented Aug 10, 2018 at 7:53
