I've got a weird question. Assume that you have a small sample where the dependent variable that you're going to analyze with a simple linear model is highly left skewed. Thus you assume that $u$ is not normally distributed, because this would result in normally distributed $y$. But when you compute the QQ-Normal plot there is evidence, that the residuals are normally distributed. Thus anyone can assume that the error term is normally distributed, although $y$ is not. So what does it mean, when the error term seems to be normally distributed, but $y$ does not?
3 Answers
It is reasonable for the residuals in a regression problem to be normally distributed, even though the response variable is not. Consider a univariate regression problem where $y \sim \mathcal{N}(\beta x, \sigma^2)$. so that the regression model is appropriate, and further assume that the true value of $\beta=1$. In this case, while the residuals of the true regression model are normal, the distribution of $y$ depends on the distribution of $x$, as the conditional mean of $y$ is a function of $x$. If the dataset has a lot of values of $x$ that are close to zero and progressively fewer the higher the value of $x$, then the distribution of $y$ will be skewed to the right. If values of $x$ are distributed symmetrically, then $y$ will be distributed symmetrically, and so forth. For a regression problem, we only assume that the response is normal conditioned on the value of $x$.
-
14$\begingroup$ (+1) I don't think this can be repeated often enough! See also the same issue discussed here. $\endgroup$– WolfgangCommented Jun 23, 2011 at 14:46
-
6$\begingroup$ I am rather (pleasantly) surprised by the number of votes as well ;o) To obtain the data used to fit the regression model, you have taken a sample from some joint distribution $p(y,x)$, from which you want to estimate $E(y|x)$. However as $y$ is a (noisy) function of $x$, the distribution of samples of $y$ must depend on the distribution of samples of $x$, for that particular sample. You may not be interested in the "true" distribution of $x$, but the sample distribution of y depends on the sample of x. $\endgroup$ Commented Jun 24, 2011 at 8:08
-
2$\begingroup$ Consider an example of estimating temperature ($y$) as a function of lattitude ($x$). The distribution of $y$ values in our sample will depend on where we choose to site out weather stations. If we place them all either at the poles or the equator, then we will have a bimodal distribution. If we place them on a regular equal area grid, we will get a unimodal distribution of $y$ values, even though the physics of climate is the same for both samples. Of course this will affect your fitted regression model, and the study of that sort of thing is known as "covariate shift". HTH $\endgroup$ Commented Jun 24, 2011 at 8:12
-
2$\begingroup$ Sorry for the pedantic question, but if $\beta = 1$ and $y = \beta x + \epsilon$ and if we have a bunch of values of $x$ close to zero and progressively less values larger values of $x$, doesn't that mean most $y$ values are also close to zero and progressively less values for larger values of $y$? If that's the case, wouldn't it be a right skewed distribution rather than a left skewed distribution? $\endgroup$– DavidCommented May 5, 2021 at 1:25
-
2$\begingroup$ Thanks @David (not pedantic at all), have edited the answer. $\endgroup$ Commented May 5, 2021 at 6:34
@DikranMarsupial is exactly right, of course, but it occurred to me that it might be nice to illustrate his point, especially since this concern seems to come up frequently. Specifically, the residuals of a regression model should be normally distributed for the p-values to be correct. However, even if the residuals are normally distributed, that doesn't guarantee that $Y$ will be (not that it matters... ); it depends on the distribution of $X$.
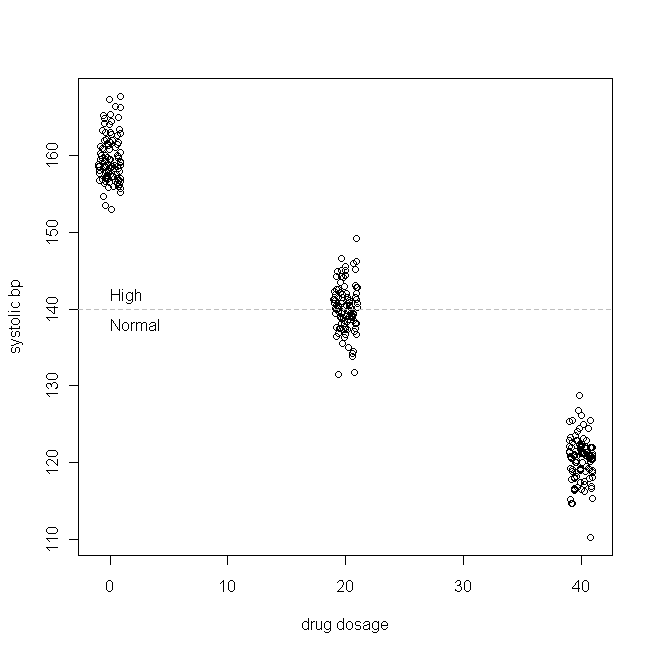
Let's take a simple example (which I am making up). Let's say we're testing a drug for isolated systolic hypertension (i.e., the top blood pressure number is too high). Let's further stipulate that systolic bp is normally distributed within our patient population, with a mean of 160 & SD of 3, and that for each mg of the drug that patients take each day, systolic bp goes down by 1mmHg. In other words, the true value of $\beta_0$ is 160, and $\beta_1$ is -1, and the true data generating function is: $$ BP_{sys}=160-1\times\text{daily drug dosage}+\varepsilon \\ \text{where }\varepsilon\sim\mathcal N(0, 9) $$ In our fictitious study, 300 patients are randomly assigned to take 0mg (a placebo), 20mg, or 40mg of this new medicine per day. (Notice that $X$ is not normally distributed.) Then, after an adequate period of time for the drug to take effect, our data might look like this:

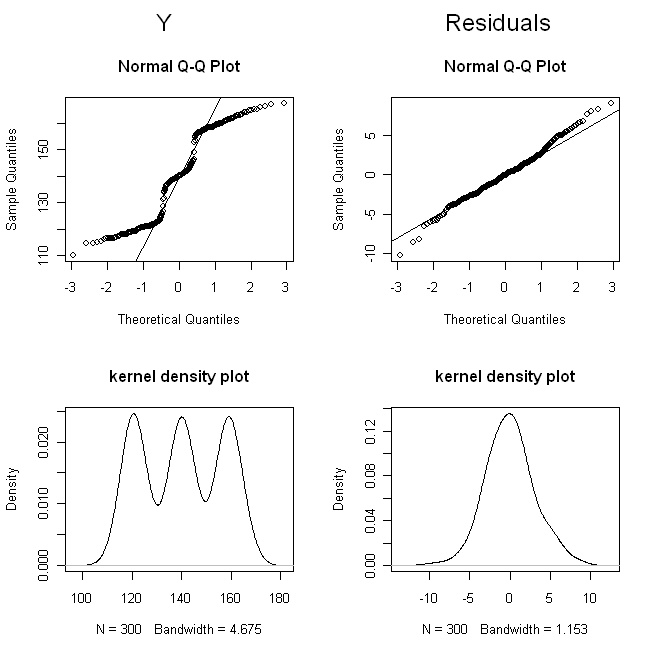
(I jittered the dosages so that the points wouldn't overlap so much that they were hard to distinguish.) Now, let's check out the distributions of $Y$ (i.e., it's marginal / original distribution), and the residuals:

The qq-plots show us that $Y$ is not remotely normal, but that the residuals are reasonably normal. The kernel density plots give us a more intuitively accessible picture of the distributions. It is clear that $Y$ is tri-modal, whereas the residuals look much like a normal distribution is supposed to look.
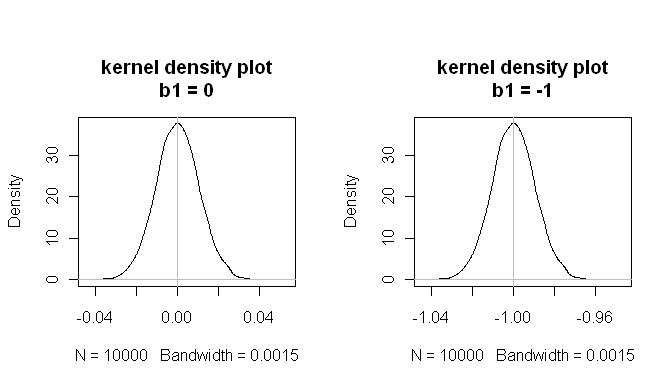
But what about the fitted regression model, what is the effect of the non-normal $Y$ & $X$ (but normal residuals)? To answer this question, we need to specify what we might be worried about regarding the typical performance of a regression model in situations like this. The first issue is, are the betas, on average, right? (Of course, they'll bounce around some, but in the long run, are the sampling distributions of the betas centered on the true values?) This is the question of bias. Another issue is, can we trust the p-values we get? That is, when the null hypothesis true, is $p<.05$ only 5% of the time? To determine these things, we can simulate data from the above data generating process and a parallel case where the drug has no effect, a large number of times. Then we can plot the sampling distributions of $\beta_1$ and check to see if they're centered on the true value, and also check how often the relationship was 'significant' in the null case:
set.seed(123456789)                       # this make the simulation repeatable

b0 = 160;   b1 = -1;   b1_null = 0        # these are the true beta values
x  = rep(c(0, 20, 40), each=100)          # the (non-normal) drug dosages patients get

estimated.b1s  = vector(length=10000)     # these will store the simulation's results
estimated.b1ns = vector(length=10000)
null.p.values  = vector(length=10000)

for(i in 1:10000){
  residuals = rnorm(300, mean=0, sd=3)
  y.works = b0 + b1*x      + residuals
  y.null  = b0 + b1_null*x + residuals    # everything is identical except b1

  model.works = lm(y.works~x)
  model.null  = lm(y.null~x)
  estimated.b1s[i]  = coef(model.works)[2]
  estimated.b1ns[i] = coef(model.null)[2]
  null.p.values[i]  = summary(model.null)$coefficients[2,4]
}
mean(estimated.b1s)       # the sampling distributions are centered on the true values
[1] -1.000084
mean(estimated.b1ns)
[1] -8.43504e-05
mean(null.p.values<.05)   # when the null is true, p<.05 5% of the time
[1] 0.0532

These results show that everything works out fine.
I won't go through the motions, but if $X$ had been normally distributed, with otherwise the same setup, the original / marginal distribution of $Y$ would have been normally distributed just as the residuals (albeit with a larger SD). I also didn't illustrate the effects of a skewed distribution of $X$ (which is was the impetus behind this question), but @DikranMarsupial's point is just as valid in that case, and it could be illustrated similarly.
-
2$\begingroup$ So the assumption of residuals being normally distributed is only for p-values to be correct? Why the p-values might go wrong if residual is not normal? $\endgroup$– avocadoCommented Feb 20, 2015 at 2:26
-
4$\begingroup$ @loganecolss, that might be better as a new question. At any rate, yes it has to do w/ whether the p-values are correct. If your residuals are sufficiently non-normal & your N is low, then the sampling distribution will differ from how it is theorized to be. Since the p-value is how much of that sampling distribution is beyond your test statistic, the p-value will be wrong. $\endgroup$ Commented Feb 20, 2015 at 2:31
-
$\begingroup$ "However, even if the residuals are normally distributed, that doesn't guarantee that 𝑌 will be (not that it matters... ); it depends on the distribution of 𝑋". hmm, if we condition on $X$ as is done typically doesn't that remove $X$ from consideration. i thought in most cases of interest, we want to know the distribution of $Y$ when conditoined on $X$ $\endgroup$– 24n8Commented Nov 14, 2023 at 1:44
-
1$\begingroup$ @24n8, the residuals are the distribution of Y conditioned on X. Regarding the assumptions of an OLS regression model, it is only the distribution of the residuals that matters. Nonetheless, people often look at the marginal distribution of Y, which is perfectly fine, it just doesn't matter if it's normal. That is the whole point of this thread. $\endgroup$ Commented Nov 14, 2023 at 12:39
-
1$\begingroup$ @24n8, to be more technical, the errors need to be normally distributed, not the residuals. But we don't have access to the errors & the residuals are an estimate of them. It is common for people to talk about the residuals. $\endgroup$ Commented Nov 26, 2023 at 13:36
In a regression model fitting, we should check for the normality of the response at each level of $X$, but not collectively as a whole since it's meaningless for this purpose. If you really need to check the normality of $Y$, then check it for each $X$ level.
-
5$\begingroup$ The marginal distribution of the response isn't "meaningless" at all; it's the marginal distribution of the response (and often should hint at models other than plain regression with normal errors). You're right in emphasising that conditional distributions are important once we entertain the model in question, but this doesn't add helpfully to existing excellent answers. $\endgroup$– Nick CoxCommented Feb 5, 2019 at 7:32
-
$\begingroup$ Some clarification: "check normality of dependent variable for each level of independent variable" same as "checking normality of residuals". From: stats.stackexchange.com/questions/435025/… $\endgroup$ Commented Nov 7, 2019 at 16:23
-
$\begingroup$ Actually this is not true. See stats.stackexchange.com/a/486951/102879 $\endgroup$ Commented Sep 13, 2020 at 12:35
