5
$\begingroup$

Suppose I'm doing a linear regression and I want to investigate how the association between a predictor X and a response Y changes according to levels of a 2-level factor G. The model would look like this:

$$E(Y) = \beta_0 + \beta_1 G + \beta_2 X + \beta_3 (G \times X)$$

My question is, why do I get a different result for the t-test on $\beta_3$ if I swap X and Y in the above model? Conceptually, these tests seem to be addressing the same question: does the X-Y association change according to levels of G? Yet, in practice, I know the tests give different results.

My intuition is that the difference has something to do with whether X and/or Y are correlated with G, but I cannot think of a formal explanation. Does anyone have a suggestion? Thanks!

$\endgroup$
5
  • 1
    $\begingroup$ see this question and answer stats.stackexchange.com/questions/2691/… $\endgroup$ Commented Mar 19, 2013 at 7:36
  • $\begingroup$ Well yes, I understand that regressing X on Y is technically not the same as regressing Y on X, but it is the same thing if you're only interested in the statistical test. Put differently, in a correlation test it doesn't matter what is X and what is Y. You will get the same t-statistic and p-value whichever way you flip them. My question is why this is no longer true as soon as you add a grouping variable. $\endgroup$
    – Ben M.
    Commented Mar 20, 2013 at 0:18
  • 3
    $\begingroup$ The linear interpolation of $E(Y_i |X_i, G_i)$ does not have to agree substantively with that of $E(X_i|Y_i, G_i)$. For example, if $$ Y_i = \beta_0 + \beta_1 X_i + \beta_2 G_i + \beta_3 X_i G_i + \varepsilon_i $$ is the correct model then rearranging terms will show you that $E(X_i | Y_i)$ depends non-linearly on $G_i$, so there's no reason to think inference about the coefficient of $Y_i G_i$ in a linear model for $X_i$ should agree with that of $\beta_3$ above. $\endgroup$
    – Macro
    Commented Apr 1, 2013 at 14:01
  • $\begingroup$ @Macro That reads like a good answer to me :-) (To be complete, you might also point out that the simpler model $Y_i=\beta_0+\beta_1X_i+\varepsilon_i$ can be rearranged into a linear dependence of $X$ on $Y$.) $\endgroup$
    – whuber
    Commented Apr 3, 2013 at 15:13
  • 1
    $\begingroup$ Hi @whuber, I thought it was sufficiently vague that it did not qualify as an answer, particularly since the two hypothesis tests often do agree. This is something that interests me and I actually spent some time on this trying to characterize situations where the two are almost guaranteed to disagree. I found some examples but not a characterization and then I got sidetracked. When/if I get a chance to come back to that, I'll post an answer. Maybe in the meantime someone else will post a good answer :) $\endgroup$
    – Macro
    Commented Apr 4, 2013 at 13:35

1 Answer 1

2
$\begingroup$

Now that I've run a couple of tests in R, I think I understand the nature of the problem a little better, so I'll make an attempt at answering my own question. To rephrase the original problem, basically the test of interest boils down to comparing an association between two independent groups. The way I see it there are three approaches to this comparison:

  1. Fisher's test for comparing independent correlations
  2. Regressing $Y$ on $X$ with a grouping variable $G$ and testing the interaction (as above)
  3. Regressing $X$ on $Y$ with a grouping variable $G$ and testing the interaction (as above)

Conceptually, all three tests ask whether some $XY$ association is significantly different in one group versus another. Having run many examples, however, I found that these three tests do not always agree, and sometimes even diverge dramatically. This seems to be something of a paradox to me.

Approaches 2 and 3 will only produce identical results if the $XY$ data are standardized within each group, prior to running the regression. This makes the regression analysis somewhat similar to Fisher's test (to my intuition, at least). For unstandardized data, the two regression tests usually agree but diverge more depending on two conditions:

  1. Larger $Y$ variance in one group versus another
  2. Moderate divergence of $XY$ correlation in the two groups

From what I've run, condition 1 seems to have an impact only to the extent that condition 2 is also an issue. When the two tests diverge strongly, one of the two models usually shows heteroscedasticity problems. The fastest way to spot something is wrong is by comparing the regression output to Fisher's test, though. I have added a picture of some data below, where the slopes differ dramatically between groups depending on whether you regress on $X$ or $Y$.

If someone could weigh in with some theoretical insight it would be most appreciated!
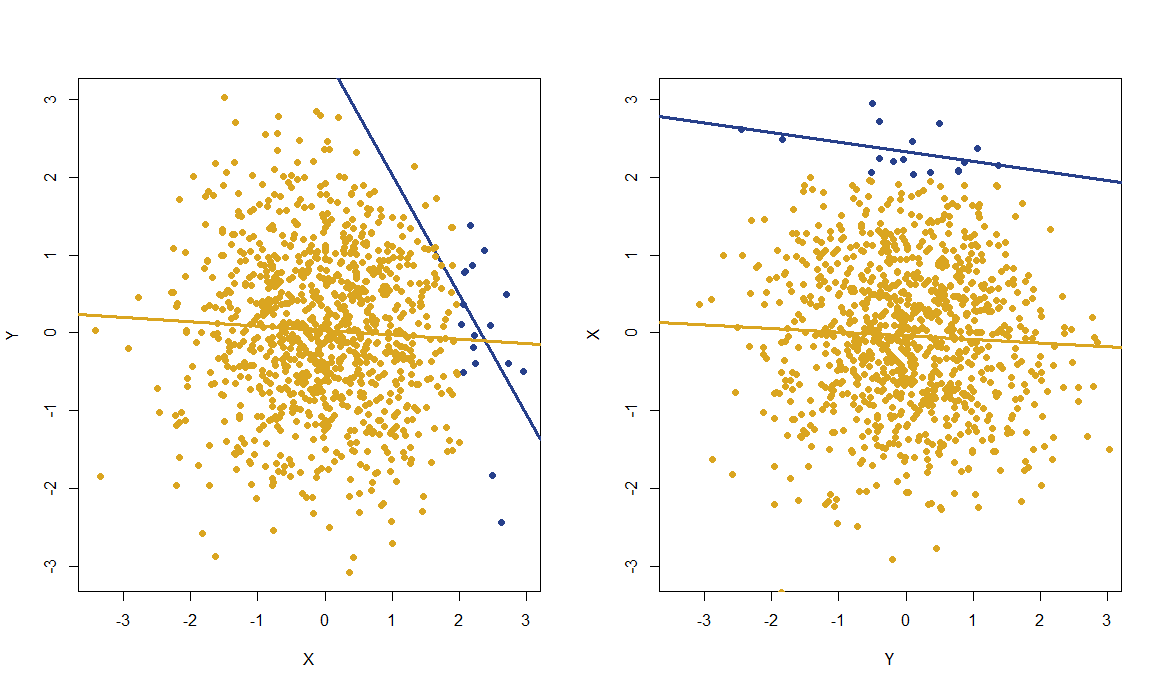
Dramatic difference between regression tests

$\endgroup$
1
  • 1
    $\begingroup$ The issue has been explained in a comment to the question by @Macro: that your models 1, 2, and 3 are all different is made clear by writing them in a way that makes the nature of random variation explicit. This is no different than noticing that regressing $Y$ on $X$ differs from regressing $X$ on $Y$. $\endgroup$
    – whuber
    Commented Jun 25, 2013 at 18:54

Your Answer

By clicking “Post Your Answer”, you agree to our terms of service and acknowledge you have read our privacy policy.

Not the answer you're looking for? Browse other questions tagged or ask your own question.