3
$\begingroup$

Permutation tests can be used to test the likelihood of obtaining a single mean value (composed of the average of k-fold CV) classifier accuracy by chance, such as for a linear classifier using two classes. The permuted label distribution generates an empirical null distribution by randomizing the relationship between the labels and the instances. The exact p value is obtained by measuring how many values of the null distribution are equal or higher than the correctly labelled accuracy.

My question is, what value should be ideally used as the 'correctly labelled accuracy'?

For the next section, it is useful to refer to this illustrative plot. enter image description here
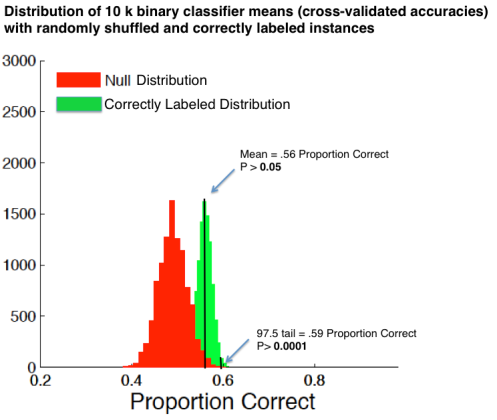
For example, the null distribution is a spread around a mean value because because the random labelling of different conditions generates slightly different answers around chance on every repeat of the classification procedure (red distribution on plot). One repeat being the mean accuracy over k-fold crossvalidation.

However, the 'correctly labelled accuracy' can also vary around a mean, simply because during k-fold cross-validation, different instances are assigned into different k-fold splits, resulting sometimes in good sometimes in better or worse values (green distribution on plot). This means that within this 'correctly labelled distribution' you will have some values that are extremely good, but highly unlikely (in the upper 97.5 confidence interval, see right hand P value). Yet often, studies report only a single accuracy instead of the mean of a distribution that has been repeated 10000 times (sometimes called bootstrapped mean and confidence intervals). So in the example plot, one could have as the mean 56 % and in the upper 97.5 tail 59 % correct, yet it is not clear where in this distribution the 'reported value' originates from.

In summary:

Question 1: If a permutation test is used to assess significance of a classifier accuracy, should the correctly labelled condition also be repeated also N- times to generate a correctly labelled distribution?

Question 2: Where in the correctly labelled distribution should the compared value originate from?

$\endgroup$

2 Answers 2

1
$\begingroup$

what value should be ideally used as the 'correctly labelled accuracy'?

The one you're testing - the one without randomized labels that you wanted to assess the probability of.

However, the 'correctly labelled accuracy' can also vary around a mean, simply because during k-fold cross-validation, different instances are assigned into different k-fold splits, resulting sometimes in good sometimes in better or worse values

Your first paragraph makes some assertions. What was the basis on which they were made?

In particular, the reference to the accuracy of a 'specific classifier' is not the same thing as a collection of related classifiers that result from that cross-validation you were discussing.

$\endgroup$
8
  • $\begingroup$ a single mean value = 1 accuracy composed of the average of k-fold crossvalidation. Clarified in question now. $\endgroup$
    – dashi
    Commented Jun 14, 2013 at 10:05
  • $\begingroup$ In which case, that single mean value can be compared with the distribution of single mean values generated via resampling procedures such as permutation tests. $\endgroup$
    – Glen_b
    Commented Jun 14, 2013 at 10:07
  • $\begingroup$ The question I had was whether this single mean value should represent the mean of the 'correctly labelled' distribution, or whether it can come from any position in the distribution 'correctly labelled' distribution. Thanks for your post. $\endgroup$
    – dashi
    Commented Jun 14, 2013 at 10:10
  • $\begingroup$ Whatever you use to measure your accuracy is what you test - but you must treat the permuted samples in exactly the same way. $\endgroup$
    – Glen_b
    Commented Jun 14, 2013 at 10:11
  • $\begingroup$ So, if I compare the 97.5 confidence value from the correctly labelled distribution I also use the 97.5 confidence interval from the null distribution? And if I compare the mean of the correct distribution, I compare with the mean of the null? $\endgroup$
    – dashi
    Commented Jun 14, 2013 at 10:14
0
$\begingroup$

In order to decrease the variance of your prediction distribution, you may consider using bootstrapping. Basically, you do randomly several splits of your data into training and test. Then, you average the results for all your splits. If your data set is not big or it contains too many patterns, you can see a much more stable metric using bootstrapping.

$\endgroup$

Your Answer

By clicking “Post Your Answer”, you agree to our terms of service and acknowledge you have read our privacy policy.

Not the answer you're looking for? Browse other questions tagged or ask your own question.