382
$\begingroup$

A former colleague once argued to me as follows:

We usually apply normality tests to the results of processes that, under the null, generate random variables that are only asymptotically or nearly normal (with the 'asymptotically' part dependent on some quantity which we cannot make large); In the era of cheap memory, big data, and fast processors, normality tests should always reject the null of normal distribution for large (though not insanely large) samples. And so, perversely, normality tests should only be used for small samples, when they presumably have lower power and less control over type I rate.

Is this a valid argument? Is this a well-known argument? Are there well known tests for a 'fuzzier' null hypothesis than normality?

$\endgroup$
5
  • $\begingroup$ See meta.stats.stackexchange.com/questions/290/… $\endgroup$
    – Shane
    Commented Sep 8, 2010 at 18:03
  • 6
    $\begingroup$ In a certain sense, this is true of all test of a finite number of parameters. With $k$ fixed (the number of parameters on which the test is caried) and $n$ growthing without bounds, any difference between the two groups (no matter how small) will always break the null at some point. Actually, this is an argument in favor of bayesian tests. $\endgroup$
    – user603
    Commented Sep 8, 2010 at 18:07
  • 2
    $\begingroup$ For me, it is not a valid argument. Anyway, before giving any answer you need to formalize things a little bit. You may be wrong and you may not be but now what you have is nothing more than an intuition: for me the sentence "In the era of cheap memory, big data, and fast processors, normality tests should always reject the null of normal " needs clarifications :) I think that if you try giving more formal precision the answer will be simple. $\endgroup$ Commented Sep 8, 2010 at 19:01
  • 10
    $\begingroup$ The thread at "Are large datasets inappropriate for hypothesis testing" discusses a generalization of this question. (stats.stackexchange.com/questions/2516/… ) $\endgroup$
    – whuber
    Commented Sep 9, 2010 at 20:17
  • $\begingroup$ "reject the null of normal distribution" needs an elaborate and correct explanation before an answer to the question can be given. Moreover there is a difference between large sample (versus small sample) and the term: large samples. There is a difference between n-size of a sample and k- sample theory of statistics. Let us be clear about it. $\endgroup$
    – user10619
    Commented Apr 22, 2019 at 15:36

15 Answers 15

283
$\begingroup$

It's not an argument. It is a (a bit strongly stated) fact that formal normality tests always reject on the huge sample sizes we work with today. It's even easy to prove that when n gets large, even the smallest deviation from perfect normality will lead to a significant result. And as every dataset has some degree of randomness, no single dataset will be a perfectly normally distributed sample. But in applied statistics the question is not whether the data/residuals ... are perfectly normal, but normal enough for the assumptions to hold.

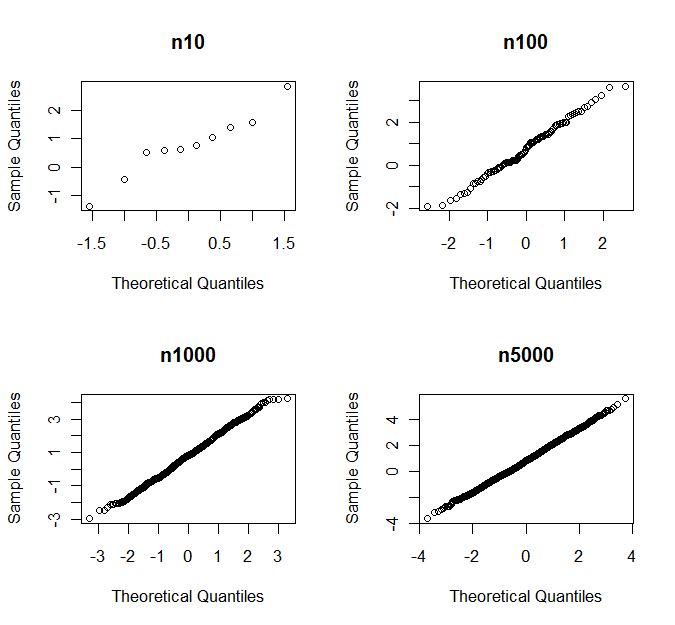
Let me illustrate with the Shapiro-Wilk test. The code below constructs a set of distributions that approach normality but aren't completely normal. Next, we test with shapiro.test whether a sample from these almost-normal distributions deviate from normality. In R:

x <- replicate(100, { # generates 100 different tests on each distribution
                     c(shapiro.test(rnorm(10)+c(1,0,2,0,1))$p.value,   #$
                       shapiro.test(rnorm(100)+c(1,0,2,0,1))$p.value,  #$
                       shapiro.test(rnorm(1000)+c(1,0,2,0,1))$p.value, #$
                       shapiro.test(rnorm(5000)+c(1,0,2,0,1))$p.value) #$
                    } # rnorm gives a random draw from the normal distribution
               )
rownames(x) <- c("n10","n100","n1000","n5000")

rowMeans(x<0.05) # the proportion of significant deviations
  n10  n100 n1000 n5000 
 0.04  0.04  0.20  0.87 

The last line checks which fraction of the simulations for every sample size deviate significantly from normality. So in 87% of the cases, a sample of 5000 observations deviates significantly from normality according to Shapiro-Wilk. Yet, if you see the qq plots, you would never ever decide on a deviation from normality. Below you see as an example the qq-plots for one set of random samples

alt text

with p-values

  n10  n100 n1000 n5000 
0.760 0.681 0.164 0.007 
$\endgroup$
29
  • 48
    $\begingroup$ On a side note, the central limit theorem makes the formal normality check unnecessary in many cases when n is large. $\endgroup$
    – Joris Meys
    Commented Sep 8, 2010 at 23:19
  • 39
    $\begingroup$ yes, the real question is not whether the data are actually distributed normally but are they sufficiently normal for the underlying assumption of normality to be reasonable for the practical purpose of the analysis, and I would have thought the CLT based argument is normally [sic] sufficient for that. $\endgroup$ Commented Sep 9, 2010 at 9:37
  • 67
    $\begingroup$ This answer appears not to address the question: it merely demonstrates that the S-W test does not achieve its nominal confidence level, and so it identifies a flaw in that test (or at least in the R implementation of it). But that's all--it has no bearing on the scope of usefulness of normality testing in general. The initial assertion that normality tests always reject on large sample sizes is simply incorrect. $\endgroup$
    – whuber
    Commented Oct 24, 2013 at 21:16
  • 25
    $\begingroup$ @whuber This answer addresses the question. The whole point of the question is the "near" in "near-normality". S-W tests what is the chance that the sample is drawn from a normal distribution. As the distributions I constructed are deliberately not normal, you'd expect the S-W test to do what it promises: reject the null. The whole point is that this rejection is meaningless in large samples, as the deviation from normality does not result in a loss of power there. So the test is correct, but meaningless, as shown by the QQplots $\endgroup$
    – Joris Meys
    Commented Oct 25, 2013 at 9:36
  • 18
    $\begingroup$ I had relied on what you wrote and misunderstood what you meant by an "almost-Normal" distribution. I now see--but only by reading the code and carefully testing it--that you are simulating from three standard Normal distributions with means at $0,$ $1,$ and $2$ and combining the results in a $2:2:1$ ratio. Wouldn't you hope that a good test of Normality would reject the null in this case? What you have effectively demonstrated is that QQ plots are not very good at detecting such mixtures, that's all! $\endgroup$
    – whuber
    Commented Oct 25, 2013 at 14:17
218
$\begingroup$

When thinking about whether normality testing is 'essentially useless', one first has to think about what it is supposed to be useful for. Many people (well... at least, many scientists) misunderstand the question the normality test answers.

The question normality tests answer: Is there convincing evidence of any deviation from the Gaussian ideal? With moderately large real data sets, the answer is almost always yes.

The question scientists often expect the normality test to answer: Do the data deviate enough from the Gaussian ideal to "forbid" use of a test that assumes a Gaussian distribution? Scientists often want the normality test to be the referee that decides when to abandon conventional (ANOVA, etc.) tests and instead analyze transformed data or use a rank-based nonparametric test or a resampling or bootstrap approach. For this purpose, normality tests are not very useful.

$\endgroup$
4
  • 26
    $\begingroup$ +1 for a good and informative answer. I find it useful to see a good explanation for a common misunderstanding (which I have incidentally been experiencing myself: stats.stackexchange.com/questions/7022/…). What I miss though, is an alternative solution to this common misunderstanding. I mean, if normality tests are the wrong way to go, how does one go about checking if a normal approximation is acceptable/justified? $\endgroup$
    – posdef
    Commented Feb 10, 2011 at 12:45
  • 7
    $\begingroup$ There's is not substitute for the (common) sense of the analyst (or, well, the researcher/scientist). And experience (learnt by trying and seeing: what conclusions do I get if I assume it is normal? What are the difference if not?). Graphics are your best friends. $\endgroup$
    – FairMiles
    Commented Apr 5, 2013 at 15:33
  • 2
    $\begingroup$ I like this paper, which makes the point you made: Micceri, T. (1989). The unicorn, the normal curve, and other improbable creatures. Psychological Bulletin, 105(1), 156-166. $\endgroup$ Commented Aug 20, 2014 at 20:18
  • 8
    $\begingroup$ Looking at graphics is great, but what if there are too many to examine manually? Can we formulate reasonable statistical procedures to point out possible trouble spots? I'm thinking of situations like A/B experimenters at large scale: exp-platform.com/Pages/…. $\endgroup$
    – dfrankow
    Commented Dec 29, 2014 at 17:41
140
$\begingroup$

I think that tests for normality can be useful as companions to graphical examinations. They have to be used in the right way, though. In my opinion, this means that many popular tests, such as the Shapiro-Wilk, Anderson-Darling and Jarque-Bera tests never should be used.

Before I explain my standpoint, let me make a few remarks:

  • In an interesting recent paper Rochon et al. studied the impact of the Shapiro-Wilk test on the two-sample t-test. The two-step procedure of testing for normality before carrying out for instance a t-test is not without problems. Then again, neither is the two-step procedure of graphically investigating normality before carrying out a t-test. The difference is that the impact of the latter is much more difficult to investigate (as it would require a statistician to graphically investigate normality $100,000$ or so times...).
  • It is useful to quantify non-normality, for instance by computing the sample skewness, even if you don't want to perform a formal test.
  • Multivariate normality can be difficult to assess graphically and convergence to asymptotic distributions can be slow for multivariate statistics. Tests for normality are therefore more useful in a multivariate setting.
  • Tests for normality are perhaps especially useful for practitioners who use statistics as a set of black-box methods. When normality is rejected, the practitioner should be alarmed and, rather than carrying out a standard procedure based on the assumption of normality, consider using a nonparametric procedure, applying a transformation or consulting a more experienced statistician.
  • As has been pointed out by others, if $n$ is large enough, the CLT usually saves the day. However, what is "large enough" differs for different classes of distributions.

(In my definiton) a test for normality is directed against a class of alternatives if it is sensitive to alternatives from that class, but not sensitive to alternatives from other classes. Typical examples are tests that are directed towards skew or kurtotic alternatives. The simplest examples use the sample skewness and kurtosis as test statistics.

Directed tests of normality are arguably often preferable to omnibus tests (such as the Shapiro-Wilk and Jarque-Bera tests) since it is common that only some types of non-normality are of concern for a particular inferential procedure.

Let's consider Student's t-test as an example. Assume that we have an i.i.d. sample from a distribution with skewness $\gamma=\frac{E(X-\mu)^3}{\sigma^3}$ and (excess) kurtosis $\kappa=\frac{E(X-\mu)^4}{\sigma^4}-3.$ If $X$ is symmetric about its mean, $\gamma=0$. Both $\gamma$ and $\kappa$ are 0 for the normal distribution.

Under regularity assumptions, we obtain the following asymptotic expansion for the cdf of the test statistic $T_n$: $$P(T_n\leq x)=\Phi(x)+n^{-1/2}\frac{1}{6}\gamma(2x^2+1)\phi(x)-n^{-1}x\Big(\frac{1}{12}\kappa (x^2-3)-\frac{1}{18}\gamma^2(x^4+2x^2-3)-\frac{1}{4}(x^2+3)\Big)\phi(x)+o(n^{-1}),$$

where $\Phi(\cdot)$ is the cdf and $\phi(\cdot)$ is the pdf of the standard normal distribution.

$\gamma$ appears for the first time in the $n^{-1/2}$ term, whereas $\kappa$ appears in the $n^{-1}$ term. The asymptotic performance of $T_n$ is much more sensitive to deviations from normality in the form of skewness than in the form of kurtosis.

It can be verified using simulations that this is true for small $n$ as well. Thus Student's t-test is sensitive to skewness but relatively robust against heavy tails, and it is reasonable to use a test for normality that is directed towards skew alternatives before applying the t-test.

As a rule of thumb (not a law of nature), inference about means is sensitive to skewness and inference about variances is sensitive to kurtosis.

Using a directed test for normality has the benefit of getting higher power against ''dangerous'' alternatives and lower power against alternatives that are less ''dangerous'', meaning that we are less likely to reject normality because of deviations from normality that won't affect the performance of our inferential procedure. The non-normality is quantified in a way that is relevant to the problem at hand. This is not always easy to do graphically.

As $n$ gets larger, skewness and kurtosis become less important - and directed tests are likely to detect if these quantities deviate from 0 even by a small amount. In such cases, it seems reasonable to, for instance, test whether $|\gamma|\leq 1$ or (looking at the first term of the expansion above) $$|n^{-1/2}\frac{1}{6}\gamma(2z_{\alpha/2}^2+1)\phi(z_{\alpha/2})|\leq 0.01$$ rather than whether $\gamma=0$. This takes care of some of the problems that we otherwise face as $n$ gets larger.

$\endgroup$
6
  • 2
    $\begingroup$ Now this is a great answer! $\endgroup$
    – user603
    Commented Apr 4, 2014 at 10:45
  • 2
    $\begingroup$ "it is common that only some types of non-normality are of concern for a particular inferential procedure." - of course one should then use a test directed towards that type of non-normality. But the fact that one is using a normality test implies that he cares about all aspects of normality. The question is: is a normality test in that case a good option. $\endgroup$
    – rbm
    Commented Jul 4, 2015 at 11:12
  • $\begingroup$ Test for the sufficiency of assumptions for particular tests are becoming common, which thankfully removes some of the guesswork. $\endgroup$
    – Carl
    Commented Jan 7, 2017 at 21:27
  • 1
    $\begingroup$ @Carl: Can you add some references/examples for that? $\endgroup$ Commented Feb 3, 2019 at 14:10
  • $\begingroup$ @kjetilbhalvorsen That was two years ago, and I do not recall now what I had in mind then. So, if you want that information, you, I, or anyone can either search for it, or better derive how such can be done form scratch. $\endgroup$
    – Carl
    Commented Feb 5, 2019 at 13:05
70
$\begingroup$

IMHO normality tests are absolutely useless for the following reasons:

  1. On small samples, there's a good chance that the true distribution of the population is substantially non-normal, but the normality test isn't powerful to pick it up.

  2. On large samples, things like the T-test and ANOVA are pretty robust to non-normality.

  3. The whole idea of a normally distributed population is just a convenient mathematical approximation anyhow. None of the quantities typically dealt with statistically could plausibly have distributions with a support of all real numbers. For example, people can't have a negative height. Something can't have negative mass or more mass than there is in the universe. Therefore, it's safe to say that nothing is exactly normally distributed in the real world.

$\endgroup$
6
  • 2
    $\begingroup$ Electrical potential difference is an example of a real-world quantity that can be negative. $\endgroup$
    – nico
    Commented Sep 19, 2010 at 13:03
  • 21
    $\begingroup$ @nico: Sure it can be negative, but there's some finite limit to it because there are only so many protons and electrons in the Universe. Of course this is irrelevant in practice, but that's my point. Nothing is exactly normally distributed (the model is wrong), but there are lots of things that are close enough (the model is useful). Basically, you already knew the model was wrong, and rejecting or not rejecting the null gives essentially no information about whether it's nonetheless useful. $\endgroup$
    – dsimcha
    Commented Sep 22, 2010 at 19:39
  • 2
    $\begingroup$ @dsimcha - I find that a really insightful, useful response. $\endgroup$
    – rolando2
    Commented May 4, 2012 at 21:34
  • 5
    $\begingroup$ @dsimcha, the $t$-test and ANOVA are not robust to non-normality. See papers by Rand Wilcox. $\endgroup$ Commented Aug 1, 2013 at 11:45
  • 1
    $\begingroup$ @dsimcha "the model is wrong". Aren't ALL models "wrong" though? $\endgroup$
    – Atirag
    Commented Dec 19, 2017 at 21:09
40
$\begingroup$

I think that pre-testing for normality (which includes informal assessments using graphics) misses the point.

  1. Users of this approach assume that the normality assessment has in effect a power near 1.0.
  2. Nonparametric tests such as the Wilcoxon, Spearman, and Kruskal-Wallis have efficiency of 0.95 if normality holds.
  3. In view of 2. one can pre-specify the use of a nonparametric test if one even entertains the possibility that the data may not arise from a normal distribution.
  4. Ordinal cumulative probability models (the proportional odds model being a member of this class) generalize standard nonparametric tests. Ordinal models are completely transformation-invariant with respect to $Y$, are robust, powerful, and allow estimation of quantiles and mean of $Y$.
$\endgroup$
3
  • 4
    $\begingroup$ note that the efficiency of 0.95 is asymptotic: FWIW I'd guess that the efficiency is much lower for typical finite sample sizes ... (although admittedly I haven't seen this studied, nor tried to explore it myself) $\endgroup$
    – Ben Bolker
    Commented Jul 23, 2019 at 18:18
  • 3
    $\begingroup$ I have explored relative efficiencies in small samples for a number of common tests; the small-sample relative efficiencies are typically lower than the ARE but at usual sample sizes generally not by very much; the ARE is generally a pretty useful guide. $\endgroup$
    – Glen_b
    Commented Dec 24, 2019 at 1:44
  • $\begingroup$ @BenBolker for small samples you are likely to have data that Shapiro-Wilk will say that's normal; for large sample sizes you are close to the asymptotic efficiency $\endgroup$ Commented Nov 22, 2020 at 12:09
21
$\begingroup$

Before asking whether a test or any sort of rough check for normality is "useful" you have to answer the question behind the question: "Why are you asking?"

For example, if you only want to put a confidence limit around the mean of a set of data, departures from normality may or not be important, depending on how much data you have and how big the departures are. However, departures from normality are apt to be crucial if you want to predict what the most extreme value will be in future observations or in the population you have sampled from.

$\endgroup$
15
$\begingroup$

Let me add one small thing:
Performing a normality test without taking its alpha-error into account heightens your overall probability of performing an alpha-error.

You shall never forget that each additional test does this as long as you don't control for alpha-error accumulation. Hence, another good reason to dismiss normality testing.

$\endgroup$
10
  • 4
    $\begingroup$ I refer to the general utility of normality tests when used as method to determine whether or not it is appropriate to use a certain method. If you apply them in these cases, it is, in terms of probability of committing an alpha error, better to perform a more robust test to avoid the alpha error accumulation. $\endgroup$
    – Henrik
    Commented Sep 10, 2010 at 10:42
  • 4
    $\begingroup$ This does not make sense to me. Even if you decide between, say, an ANOVA or a rank-based method based on a test of normality (a bad idea of course), at the end of the day you would still only perform one test of the comparison of interest. If you reject normality erroneously, you still haven't reached a wrong conclusion regarding this particular comparison. You might be performing two tests but the only case in which you can conclude that factor such-and-such have an effect is when the second test also rejects $H_0$, not when only the first one does. Hence, no alpha-error accumulation… $\endgroup$
    – Gala
    Commented Jun 8, 2013 at 11:24
  • 3
    $\begingroup$ Another way a normality test could increase type I errors is if we're talking about "overall probability of performing an alpha-error." The test itself has an error rate, so overall, our probability of committing an error increases. Emphasis on one small thing too I suppose... $\endgroup$ Commented Nov 8, 2013 at 15:49
  • 2
    $\begingroup$ @NickStauner That is exactly what I wanted to convey. Thanks for making this point even clearer. $\endgroup$
    – Henrik
    Commented Nov 9, 2013 at 12:25
  • 2
    $\begingroup$ @Gala Actually, the type I error rate of the final test conducted (parametric or non-parametric chosen based on a normality test) is inflated even for normally distributed residuals (the type I error rate inflation can often even be worse, if you have non-normal residuals depending on which combiantion of tests you use). The tests are not unrelated and this has been shown over and over again in the literature. $\endgroup$
    – Björn
    Commented Mar 26, 2018 at 16:25
14
$\begingroup$

I used to think that tests of normality were completely useless.

However, now I do consulting for other researchers. Often, obtaining samples is extremely expensive, and so they will want to do inference with n = 8, say.

In such a case, it is very difficult to find statistical significance with non-parametric tests, but t-tests with n = 8 are sensitive to deviations from normality. So what we get is that we can say "well, conditional on the assumption of normality, we find a statistically significant difference" (don't worry, these are usually pilot studies...).

Then we need some way of evaluating that assumption. I'm half-way in the camp that looking at plots is a better way to go, but truth be told there can be a lot of disagreement about that, which can be very problematic if one of the people who disagrees with you is the reviewer of your manuscript.

In many ways, I still think there are plenty of flaws in tests of normality: for example, we should be thinking about the type II error more than the type I. But there is a need for them.

$\endgroup$
7
  • $\begingroup$ Note that the arguments here is that the tests are only useless in theory. In theory, we can always get as many samples as we want... You'll still need the tests to prove that your data is at least somehow close to normality. $\endgroup$
    – SmallChess
    Commented May 20, 2015 at 2:43
  • 3
    $\begingroup$ Good point. I think what you're implying, and certainly what I believe, is that a measure of deviation from normality is more important than a hypothesis test. $\endgroup$
    – Cliff AB
    Commented May 20, 2015 at 3:50
  • 5
    $\begingroup$ Power of a test of normality will be very low at n=8; in particular, deviations from normality that will substantively affect the properties of a test that assumes it may be quite hard to detect at small sample sizes (whether by test or visually). $\endgroup$
    – Glen_b
    Commented Jul 13, 2018 at 0:32
  • 2
    $\begingroup$ @Glen_b: I agree; I think this sentiment is in line with caring more about type II errors rather than type I. My point is that there is real world need to test for normality. Whether our current tools really fill that need is a different question. $\endgroup$
    – Cliff AB
    Commented Feb 3, 2019 at 16:40
  • 2
    $\begingroup$ Nearly all testing for normality I have seen is to check distributional assumptions on the data being used in the test prior to using a test that relies on that assumption; performing such a check at all is itself a potentially serious problem - it certainly has consequences for the inference. If that's the need you refer to I'd say there's a strong perception that there's a need to test, but there are nearly always better things to do. There are occasionally good reasons to test goodness of fit, but they're rarely what these tests are used for. $\endgroup$
    – Glen_b
    Commented Feb 3, 2019 at 23:43
13
$\begingroup$

For what it's worth, I once developed a fast sampler for the truncated normal distribution, and normality testing (KS) was very useful in debugging the function. This sampler passes the test with huge sample sizes but, interestingly, the GSL's ziggurat sampler didn't.

$\endgroup$
13
$\begingroup$

Answers here have already addressed several important points. To quickly summarize:

  • There is no consistent test that can determine whether a set of data truly follow a distribution or not.
  • Tests are no substitute for visually inspecting the data and models to identify high leverage, high influence observations and commenting on their effects on models.
  • The assumptions for many regression routines are often misquoted as requiring normally distributed "data" [residuals] and that this is interpreted by novice statisticians as requiring that the analyst formally evaluate this in some sense before proceeding with analyses.

I am adding an answer firstly to cite to one of my, personally, most frequently accessed and read statistical articles: "The Importance of Normality Assumptions in Large Public Health Datasets" by Lumley et al. It is worth reading in entirety. The summary states:

The t-test and least-squares linear regression do not require any assumption of Normal distribution in sufficiently large samples. Previous simulations studies show that “sufficiently large” is often under 100, and even for our extremely non-Normal medical cost data it is less than 500. This means that in public health research, where samples are often substantially larger than this, the t-test and the linear model are useful default tools for analyzing differences and trends in many types of data, not just those with Normal distributions. Formal statistical tests for Normality are especially undesirable as they will have low power in the small samples where the distribution matters and high power only in large samples where the distribution is unimportant.

While the large-sample properties of linear regression are well understood, there has been little research into the sample sizes needed for the Normality assumption to be unimportant. In particular, it is not clear how the necessary sample size depends on the number of predictors in the model.

The focus on Normal distributions can distract from the real assumptions of these methods. Linear regression does assume that the variance of the outcome variable is approximately constant, but the primary restriction on both methods is that they assume that it is sufficient to examine changes in the mean of the outcome variable. If some other summary of the distribution is of greater interest, then the t-test and linear regression may not be appropriate.

To summarize: normality is generally not worth the discussion or the attention it receives in contrast to the importance of answering a particular scientific question. If the desire is to summarize mean differences in data, then the t-test and ANOVA or linear regression are justified in a much broader sense. Tests based on these models remain of the correct alpha level, even when distributional assumptions are not met, although power may be adversely affected.

The reasons why normal distributions may receive the attention they do may be for classical reasons, where exact tests based on F-distributions for ANOVAs and Student-T-distributions for the T-test could be obtained. The truth is, among the many modern advancements of science, we generally deal with larger datasets than were collected previously. If one is in fact dealing with a small dataset, the rationale that those data are normally distributed cannot come from those data themselves: there is simply not enough power. Remarking on other research, replications, or even the biology or science of the measurement process is, in my opinion, a much more justified approach to discussing a possible probability model underlying the observed data.

For this reason, opting for a rank-based test as an alternative misses the point entirely. However, I will agree that using robust variance estimators like the jackknife or bootstrap offer important computational alternatives that permit conducting tests under a variety of more important violations of model specification, such as independence or identical distribution of those errors.

$\endgroup$
6
  • $\begingroup$ This is simply not the case, and such opinions usually fail to consider the non-coverage probabilities in both tails for a confidence interval. For example, n=50,000 from a log-normal distribution is inadequate for the central limit theorem to work well enough when computing the CI for a mean. $\endgroup$ Commented Nov 22, 2020 at 12:23
  • $\begingroup$ @FrankHarrell truly it's impossible for the "truth" to be entirely one way or the other when we are speaking in broad terms. Agree that for a skewed distribution using a symmetric confidence interval will be inefficient (too broad), but on the other hand it is correct in that it "covers the replicates" 95% of the time. $\endgroup$
    – AdamO
    Commented Nov 23, 2020 at 16:19
  • $\begingroup$ Beg to disagree. It is not appropriate to consider confidence coverage devoid of directionality IMHO, and if a method works poorly under likely-to-occur situations, the method is usually not good enough for field use where asymptotics are completely irrelevant. $\endgroup$ Commented Nov 23, 2020 at 22:09
  • $\begingroup$ @FrankHarrell Do you mean that, in a simulation of $10,000$ iterations, of the $\sim 500$ $95\%$ confidence intervals that should fail to contain the mean, we should be concerned that the split is $\sim 250$ with upper endpoints below the mean and $\sim 250$ with lower endpoints above the mean, rather than most of the intervals missing high (or low)? $\endgroup$
    – Dave
    Commented Mar 19, 2021 at 10:34
  • 1
    $\begingroup$ You're missing something big. You have to actually compute the two confidence tail non-coverages to get the point. "Looking normal" isn't nearly good enough. $\endgroup$ Commented Mar 31, 2023 at 17:55
9
$\begingroup$

I think the first 2 questions have been thoroughly answered but I don't think question 3 was addressed. Many tests compare the empirical distribution to a known hypothesized distribution. The critical value for the Kolmogorov-Smirnov test is based on F being completely specified. It can be modified to test against a parametric distribution with parameters estimated. So if fuzzier means estimating more than two parameters then the answer to the question is yes. These tests can be applied the 3 parameter families or more. Some tests are designed to have better power when testing against a specific family of distributions. For example when testing normality the Anderson-Darling or the Shapiro-Wilk test have greater power than K-S or chi square when the null hypothesized distribution is normal. Lillefors devised a test that is preferred for exponential distributions.

$\endgroup$
9
$\begingroup$

The argument you gave is an opinion. I think that the importance of normality testing is to make sure that the data does not depart severely from the normal. I use it sometimes to decide between using a parametric versus a nonparametric test for my inference procedure. I think the test can be useful in moderate and large samples (when the central limit theorem does not come into play). I tend to use Wilk-Shapiro or Anderson-Darling tests but running SAS I get them all and they generally agree pretty well. On a different note I think that graphical procedures such as Q-Q plots work equally well. The advantage of a formal test is that it is objective. In small samples it is true that these goodness of fit tests have practically no power and that makes intuitive sense because a small sample from a normal distribution might by chance look rather non normal and that is accounted for in the test. Also high skewness and kurtosis that distinguish many non normal distributions from normal distributions are not easily seen in small samples.

$\endgroup$
8
  • 3
    $\begingroup$ While it certainly can be used that way, I don't think you will be more objective than with a QQ-Plot. The subjective part with the tests is when to decide that your data is to non-normal. With a large sample rejecting at p=0.05 might very well be excessive. $\endgroup$
    – Erik
    Commented May 4, 2012 at 17:56
  • 4
    $\begingroup$ Pre-testing (as suggested here) can invalidate the Type I error rate of the overall process; one should take into account the fact that a pre-test was done when interpreting the results of whichever test it selected. More generally, hypothesis tests should be kept for testing null hypothesis one actually cares about, i.e. that there is no association between variables. The null hypothesis that the data is exactly Normal doesn't fall into this category. $\endgroup$
    – guest
    Commented May 4, 2012 at 18:02
  • 1
    $\begingroup$ (+1) There is excellent advice here. Erik, the use of "objective" took me aback too, until I realized Michael's right: two people correctly conducting the same test on the same data will always get the same p-value, but they might interpret the same Q-Q plot differently. Guest: thank you for the cautionary note about Type I error. But why should we not care about the data distribution? Frequently that is interesting and valuable information. I at least want to know whether the data are consistent with the assumptions my tests are making about them! $\endgroup$
    – whuber
    Commented May 4, 2012 at 18:25
  • 2
    $\begingroup$ I am very surprised that anyone would argue that formal hypothesis testing is no more objective that studying a QQ plot. I think Bill Huber explained well what I would have said in rebuttal. I don't know if I can change Erik's mind on this but I would add that you choose a test statistic and a critical value based on a significance level that you decide on (choice of significance level could be by tradition like picking 0.05 or it may be decided by your subjective reasoning about what is the risk you want to take for committing a type I error). $\endgroup$ Commented May 5, 2012 at 17:12
  • 2
    $\begingroup$ All of this can be done prior to collecting any data. At that point the decision is deterministic. You collect the data, compute the test statistic and then reject if it exceeds the critical value and you don't reject if it doesn't. You do not change anything based on the data. With the QQ plot there is no predetermined rule. Basically you create the plot based on the data and decide for yourself based on what you see whether or not you think the data follows closely to a straight line. Two people can certainly differ based on personal judgement coming from looking at the result. $\endgroup$ Commented May 5, 2012 at 17:13
8
$\begingroup$

I think a maximum entropy approach could be useful here. We can assign a normal distribution because we believe the data is "normally distributed" (whatever that means) or because we only expect to see deviations of about the same Magnitude. Also, because the normal distribution has just two sufficient statistics, it is insensitive to changes in the data which do not alter these quantities. So in a sense you can think of a normal distribution as an "average" over all possible distributions with the same first and second moments. this provides one reason why least squares should work as well as it does.

$\endgroup$
1
  • $\begingroup$ Nice bridging of concepts. I also agree that in cases where such a distribution matters, it is far more illuminating to think about how the data are generated. We apply that principle in fitting mixed models. Concentrations or ratios on the other hand are always skewed. I might add that by "the normal... is insensitive to changes" you mean invariant to changes in shape/scale. $\endgroup$
    – AdamO
    Commented Mar 13, 2018 at 13:17
8
$\begingroup$

I wouldn't say it is useless, but it really depends on the application. Note, you never really know the distribution the data is coming from, and all you have is a small set of the realizations. Your sample mean is always finite in sample, but the mean could be undefined or infinite for some types of probability density functions. Let us consider the three types of Levy stable distributions i.e Normal distribution, Levy distribution and Cauchy distribution. Most of your samples do not have a lot of observations at the tail (i.e away from the sample mean). So empirically it is very hard to distinguish between the three, so the Cauchy (has undefined mean) and the Levy (has infinite mean) could easily masquerade as a normal distribution.

$\endgroup$
6
  • 1
    $\begingroup$ "...empirically it is very hard..." seems to argue against, rather than for, distributional testing. This is strange to read in a paragraph whose introduction suggests there are indeed uses for distributional testing. What, then, are you really trying to say here? $\endgroup$
    – whuber
    Commented Oct 24, 2014 at 20:54
  • 3
    $\begingroup$ I am against it, but I also want to be careful than just saying it is useless as I don't know the entire set of possible scenarios out there. There are many tests that depend on the normality assumption. Saying that normality testing is useless is essentially debunking all such statistical tests as you are saying that you are not sure that you are using/doing the right thing. In that case you should not do it, you should not do this large section of statistics. $\endgroup$
    – kolonel
    Commented Oct 24, 2014 at 22:16
  • $\begingroup$ Thank you. The remarks in that comment seem to be better focused on the question than your original answer is! You might consider updating your answer at some point to make your opinions and advice more apparent. $\endgroup$
    – whuber
    Commented Oct 24, 2014 at 22:18
  • $\begingroup$ @whuber No problem. Can you recommend an edit? $\endgroup$
    – kolonel
    Commented Oct 24, 2014 at 22:21
  • 1
    $\begingroup$ You might start with combining the two posts--the answer and your comment--and then think about weeding out (or relegating to an appendix or clarifying) any material that may be tangential. For instance, the reference to undefined means as yet has no clear bearing on the question and so it remains somewhat mysterious. $\endgroup$
    – whuber
    Commented Oct 24, 2014 at 22:23
6
$\begingroup$

Tests where "something" important to the analysis is supported by high p-values are I think wrong headed. As others pointed out, for large data sets, a p-value below 0.05 is assured. So, the test essentially "rewards" for small and fuzzy data sets and "rewards" for a lack of evidence. Something like qq plots are much more useful. The desire for hard numbers to decide things like this always (yes/no normal/not normal) misses that modeling is partially an art and how hypotheses are actually supported.

$\endgroup$
2
  • 2
    $\begingroup$ It remains that a large sample that is nearly normal will have a low p-value while a smaller sample that is not nearly as normal will often not. I do not think that large p-values are useful. Again, they reward for a lack of evidence. I can have a sample with several million data points, and it will nearly always reject the normality assumption under these tests while a smaller sample will not. Therefore, I find them not useful. If my thinking is flawed please show it using some deductive reasoning on this point. $\endgroup$
    – wvguy8258
    Commented Jul 9, 2014 at 7:43
  • 1
    $\begingroup$ This doesn't answer the question at all. $\endgroup$
    – SmallChess
    Commented Feb 2, 2015 at 0:52

Not the answer you're looking for? Browse other questions tagged or ask your own question.