2
$\begingroup$

I need find which is the best model / variables for explaining the species richness of Coleoptera in Hawaii islands.

This is the input:

biogeo <- read.table("DataIslands.txt", h=T)
species <- read.table("DataSpecies.txt", h=T)

SR_Coleop_Mac <- species$Coleoptera
SR_Coleop_Mac <- log10(species$Coleoptera + 1)

biogeo$Area <- log10(biogeo$Area)

regMODEL_Coleop <- lm(SR_Coleop_Mac ~ Area + Age + Altitude,  
                            data = biogeo, na.action = na.fail)

summary(regMODEL_Coleop)

selec_Coleop <- dredge(regMODEL_Coleop)
selec_Coleop

get.models(selec_Coleop, subset = delta < 2)

imp_Coleop <- importance(selec_Coleop)

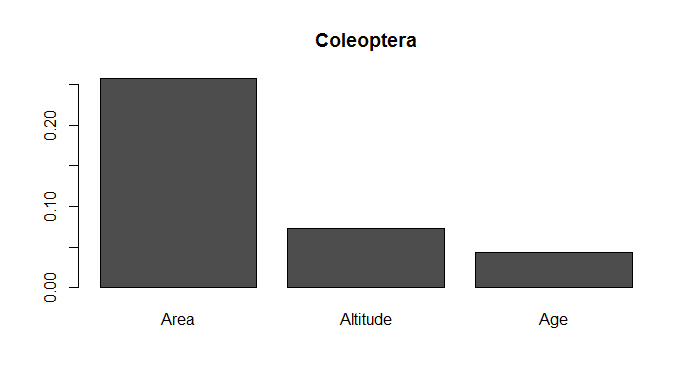
barplot(t(imp_Coleop), main="Coleoptera")

This is the output:

Model selection table 
    (Intrc)      Age      Alttd   Area df logLik AICc delta weight
1  0.480300                             2 -5.633 17.7  0.00  0.643
5 -0.980600                     0.5004  3 -3.815 19.6  1.96  0.241
3  0.270400           0.0001249         3 -5.217 22.4  4.77  0.059
2  0.421200  0.02492                    3 -5.608 23.2  5.55  0.040
7 -2.490000          -0.0004072 1.2520  4 -2.048 25.4  7.76  0.013
6 -1.250000  0.06789            0.5376  4 -3.527 28.4 10.72  0.003
4  0.006534  0.08092  0.0001675         4 -4.971 31.3 13.61  0.001
8 -2.508000 -0.01589 -0.0004289 1.2830  5 -2.031 44.1 26.40  0.000

This is the plot:

enter image description here

Which is the best model / variables? What does model 1 mean? What does intercept mean? I should log10(Age) and log10(Altitude)?

Considering:

  • AIC delta of the Model1 and Model5 <2

    • These are the best models. But:
    • Model 1 only had result with interception
    • Model 5 had result with interception and area
  • So, the model 5 is the best?

$\endgroup$
2
  • $\begingroup$ Based on your result, I would return to plotting the data and start considering non-linear relationships. $\endgroup$
    – Roland
    Commented Jan 6, 2017 at 7:01
  • $\begingroup$ Please register &/or merge your accounts (you can find information on how to do this in the My Account section of our help center), then you will be able to edit & comment on your own question. $\endgroup$ Commented Jan 6, 2017 at 15:54

2 Answers 2

3
$\begingroup$

My first inclination is to say 'none of them'. The function ?dredge is named after data dredging—it isn't a complement. This is something you really shouldn't do (to understand that more, it may help you to see my answer here: Algorithms for automatic model selection).

At any rate, the output lists the best fitting model for each possible combination of variables. You have 3 variables, each of which could be included in the model or not, thus there are $2^3=8$ possible combinations of variables, each of which has a best fitting set of parameters. Those 8 models are then ranked according to the AICc. Lower AICc's are better. Thus, the best model has a global mean, but does not use age, altitude, or area as predictors.

$\endgroup$
2
$\begingroup$

As @gung pointed out, the output shows the model 'rank' from best to worst according to AICc score; the values under each predictor column indicate the estimated coefficient for that parameter in that model. Since your "best" model is blank for all three, your summary indicates that none of the predictors improve model fit.

There is significant controversy about how to best go about model selection; see Analysing Ecological Data by Zuur (2011) for a life sci-related discussion. Some argue that dredging is the most empirical method, others find the 'whole kitchen sink' approach to be unacceptable as it doesn't account for ecological knowledge and is likely to result in overfitted models. (The former is an incredibly brief summary of a nuanced debate.)

In this case, you don't have a large amount of predictors (only 3), but the fact that none boast predictive power to your response variable is concerning. I would reassess how and why I chose to use these three, and possibly perform some exploratory data analysis beforehand using additional predictors. My intuition also says that some predictors (like Area and Age) are on very different scales; you may consider re-scaling/transforming. -MK

$\endgroup$
1
  • $\begingroup$ Rescaling, or other linear transformations, should make no difference unless there are numerical instabilities in the fitting algorithm (which, in this case will just be lm()). $\endgroup$ Commented Jan 6, 2017 at 0:58

Your Answer

By clicking “Post Your Answer”, you agree to our terms of service and acknowledge you have read our privacy policy.

Not the answer you're looking for? Browse other questions tagged or ask your own question.