0
$\begingroup$

I am trying to better learn about the Probability Calibration of Statistical Models . For example, if a Random Forest model is trained on a binary supervised classification problem :

library(mlbench)
library(randomForest)
data(sonar)

rf <- randomForest(Class ~ ., data=Sonar, importance=TRUE,
                        proximity=TRUE)

prob = predict(rf,Sonar,type="prob")

pred = data.frame(cbind(prob , rf$predicted))

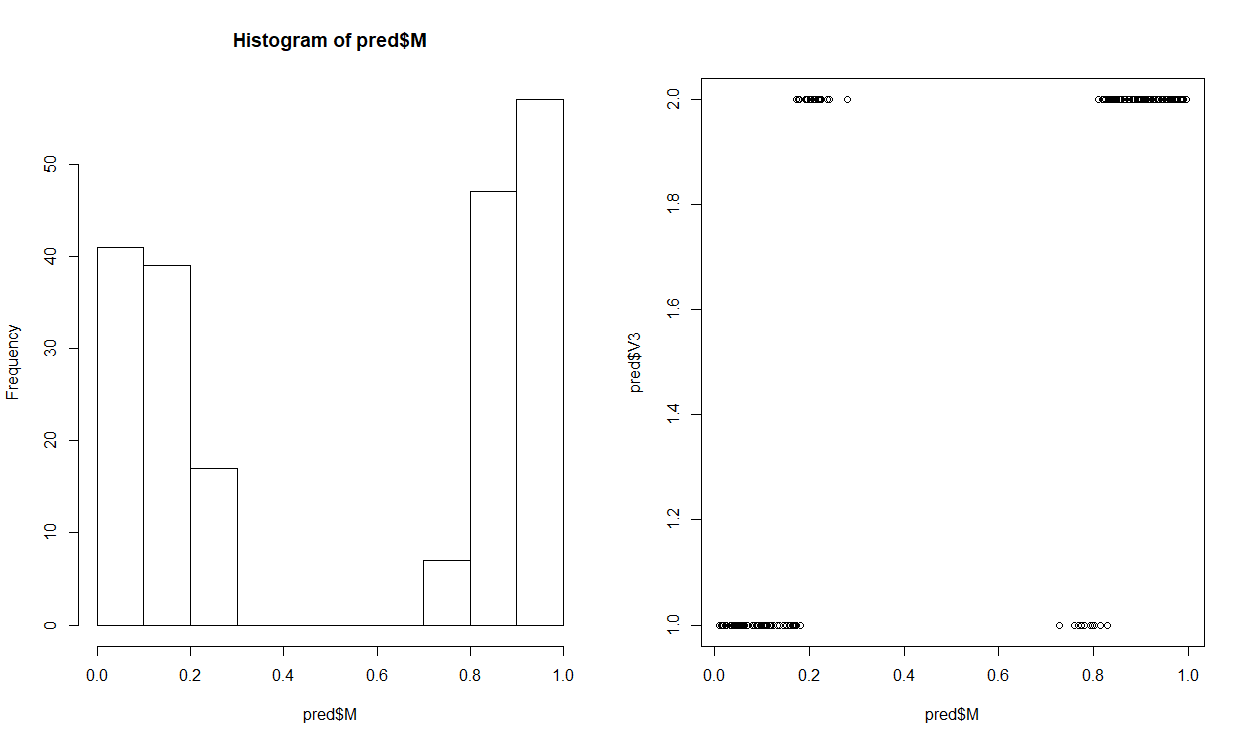
plot(pred$M, pred$V3)
plot(hist(pred$M))

enter image description here

As far as I understand, Probability Calibration would involve fitting a second statistical model (e.g. logistic regression) to the probability scores generated by the random forest model. For example:

pred$V3 = as.factor(ifelse(pred$V3 == "1", "0", "1"))
mylogit <- glm(V3 ~ M, data = pred, family = "binomial")

In a random forest model, if the generated probability is greater than 0.5, it belongs to the first class. If the probability is less than 0.5, it belongs to the other class. This is a very general rule which might not be very accurate. Probability Calibration might be able to solve this problem?

My Question: Can someone please tell me if my understanding of Probability Calibration is correct?

Thanks

$\endgroup$

1 Answer 1

1
$\begingroup$

Calibration is not related to going from a probability prediction to a hard classification. Even in a well-calibrated model, you might not want your threshold to be $0.5$. Imagine something like fraud detection. I don't want my bank alerting me willy-nilly, but if there's a $45\%$ chance that a transaction is fraudulent, that's worth my attention, even though it probably isn't fraud.

Calibration aims to investigate if the model is predicting the correct probabilities of class membership and correct the predictions if they are off. Sure, a model might come back with a probability prediction of $0.6$, but if almost all (say $95\%$) of the probability predictions of $0.6$ turn out to belong to class $1$, a probability of $0.6$ really means that there is a probability of $0.95$ of being in class $1$. We would say that the model is miscalibrated.

The magic of a function like rms::calibrate in R is that it can do calibration even when none of the probability predictions are the same. I confess that I have yet to figure out exactly what Harrell does in that function, however.

A potential resource is the sklearn documentation on model calibration, and I think this is a good statistics writeup, even for people who don't program in Python or do but not in sklearn.

$\endgroup$
2
  • $\begingroup$ Thank you so much for your answer! I will read this link! Just a question: is probability calibration the same thing as isotonic regression? Or is this something different? Thank you! $\endgroup$
    – stats_noob
    Commented Nov 14, 2021 at 4:55
  • 1
    $\begingroup$ I could believe that isotonic regression could be useful in mapping your miscalibrated probability predictions into calibrated probability values, but I wouldn't consider those terms to be synonyms. $\endgroup$
    – Dave
    Commented Nov 14, 2021 at 4:57

Your Answer

By clicking “Post Your Answer”, you agree to our terms of service and acknowledge you have read our privacy policy.

Not the answer you're looking for? Browse other questions tagged or ask your own question.