One measure of skewness is based on mean-median - Pearson's second skewness coefficient.
Another measure of skewness is based on the relative quartile differences (Q3-Q2) vs (Q2-Q1) expressed as a ratio
When (Q3-Q2) vs (Q2-Q1) is instead expressed as a difference (or equivalently midhinge-median), that must be scaled to make it dimensionless (as usually needed for a skewness measure), say by the IQR, as here (by putting $u=0.25$).
The most common measure is of course third-moment skewness.
There's no reason that these three measures will necessarily be consistent. Any one of them could be different from the other two.
What we regard as "skewness" is a somewhat slippery and ill-defined concept. See here for more discussion.
If we look at your data with a normal qqplot:

[The line marked there is based on the first 6 points only, because I want to discuss the deviation of the last two from the pattern there.]
We see that the smallest 6 points lie almost perfectly on the line.
Then the 7th point is below the line (closer to the middle relatively than the corresponding second point in from the left end), while the eighth point sits way above.
The 7th point suggests mild left skew, the last, stronger right skew. If you ignore either point, the impression of skewness is entirely determined by the other.
If I had to say it was one or the other, I'd call that "right skew" but I'd also point out that the impression was entirely due to the effect of that one very large point. Without it there's really nothing to say it's right skew. (On the other hand, without the 7th point instead, it's clearly not left skew.)
We must be very careful when our impression is entirely determined by single points, and can be flipped around by removing one point. That's not much of a basis to go on!
I start with the premise that what makes an outlier 'outlying' is the model (what's an outlier with respect on one model may be quite typical under another model).
I think an observation at the 0.01 upper percentile (1/10000) of a normal (3.72 sds above the mean) is equally an outlier to the normal model as an observation at the 0.01 upper percentile of an exponential distribution is to the exponential model. (If we transform a distribution by its own probability integral transform, each will go to the same uniform)
To see the problem with applying the boxplot rule to even a moderately right skew distribution, simulate large samples from an exponential distribution.
E.g. if we simulate samples of size 100 from a normal, we average less than 1 outlier per sample. If we do it with an exponential, we average around 5. But there's no real basis on which to say that a higher proportion of exponential values are "outlying" unless we do it by comparison with (say) a normal model. In particular situations we might have specific reasons to have an outlier rule of some particular form, but there's no general rule, which leaves us with general principles like the one I started with on this subsection - to treat each model/distribution on its own lights (if a value isn't unusual with respect to a model, why call it an outlier in that situation?)
To turn to the question in the title:
While it's a pretty crude instrument (which is why I looked at the QQ-plot) there are several indications of skewness in a boxplot - if there's at least one point marked as an outlier, there's potentially (at least) three:

In this sample (n=100), the outer points (green) mark the extremes, and with the median suggest left skewness. Then the fences (blue) suggest (when combined with the median) suggest right skewness. Then the hinges (quartiles, brown), suggest left skewness when combined with the median.
As we see, they needn't be consistent. Which you would focus on depends on the situation you're in (and possibly your preferences).
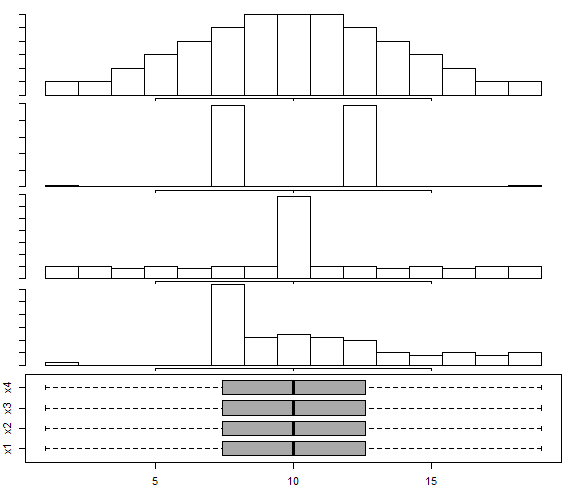
However, a warning on just how crude the boxplot is. The example toward the end here -- which includes a description of how to generate the data --
gives four quite different distributions with the same boxplot:

As you can see there's a quite skewed distribution with all of the above-mentioned indicators of skewness showing perfect symmetry.
--
Let's take this from the point of view "what answer was your teacher expecting, given that this is a boxplot, which marks one point as an outlier?".
We're left with first answering "do they expect you to assess skewness excluding that point, or with it in the sample?". Some would exclude it, and assess skewness from what remains, as jsk did in another answer. While I have disputed aspects of that approach, I can't say it's wrong -- that depends on the situation. Some would include it (not least because excluding 12.5% of your sample because of a rule derived from normality seems a big step*).
* Imagine a population distribution which is symmetric except for the far right tail (I constructed one such in answering this - normal but with the extreme right tail being Pareto - but didn't present it in my answer). If I draw samples of size 8, often 7 of the observations come from the normal-looking part and one comes from the upper tail. If we exclude the points marked as boxplot-outliers in that case, we're excluding the point that's telling us that it is actually skew! When we do, the truncated distribution that remains in that situation is left-skew, and our conclusion would be the opposite of the correct one.


