Edited to add further information including a histogram of the transformed variable
Source Link

How can I estimate the tail of a distribution with a truncated distribution?

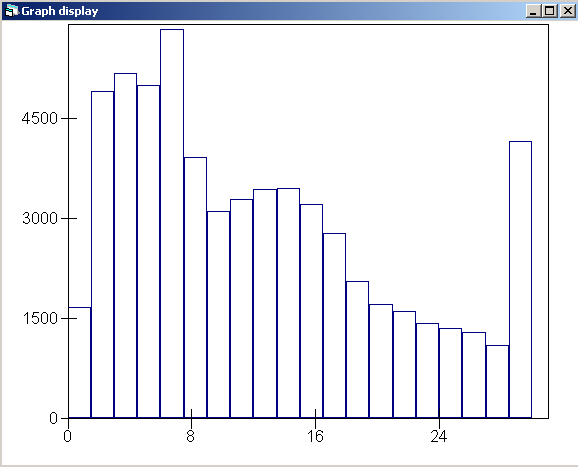
The broadband speed data I'm working with have all values over 3030Mbps placed into a >30 category. The distribution is thus truncated. This leads to the final column in the histographhistogram below being a catch-all for any values above this point. I've been advised to remove the final column. I'm tyring to develop a multilevel model which uses a variety of economic and socio economic varaibles at the postcode level and above.

Can anyone suggest a method to help me smooth out this spike in the distribution please? Is it possible to estimate the distribution of this variable above this cut off point?
enter image description here

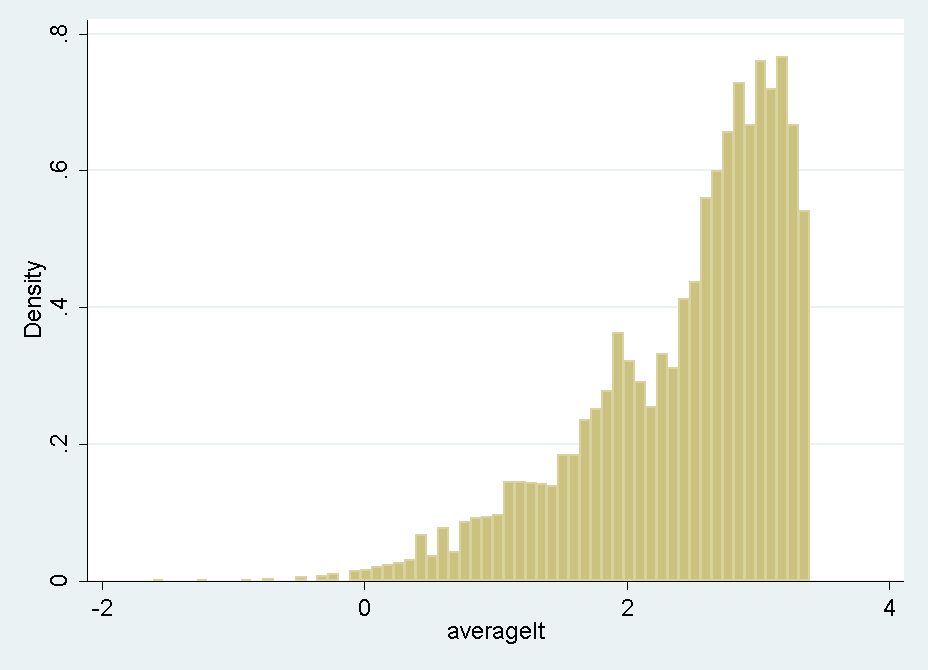
Edit: After removing the final column of the distribution and log transforming the data, I still end up with a distribution like the histigram below. Can anyone advise any techniques on how I could better deal with this truncated distribution please?
enter image description here

How can I estimate the tail of a distribution?

The data I'm working with have all values over 30 placed into a >30 category. This leads to the final column in the histograph below being a catch-all for any values above this point.

Can anyone suggest a method to help me smooth out this spike in the distribution please? Is it possible to estimate the distribution of this variable above this cut off point?

enter image description here

How can I estimate the tail of a distribution with a truncated distribution?

The broadband speed data I'm working with have all values over 30Mbps placed into a >30 category. The distribution is thus truncated. This leads to the final column in the histogram below being a catch-all for any values above this point. I've been advised to remove the final column. I'm tyring to develop a multilevel model which uses a variety of economic and socio economic varaibles at the postcode level and above.

Can anyone suggest a method to help me smooth out this spike in the distribution please? Is it possible to estimate the distribution of this variable above this cut off point?

enter image description here

Edit: After removing the final column of the distribution and log transforming the data, I still end up with a distribution like the histigram below. Can anyone advise any techniques on how I could better deal with this truncated distribution please?

enter image description here

deleted 26 characters in body
Source Link
Nick Cox
  • 59.4k
  • 8
  • 136
  • 212

The data I'm working with have all values over 30 placed into a >30 category. This leads to the final column in the histograph below being a catch-all for any values above this point.

Can anyone suggest a method to help me smooth out this spike in the distribution please? Is it possible to estimate the distribution of this variable above this cut off point?

enter image description here

Thank for your help,

Ed

The data I'm working with have all values over 30 placed into a >30 category. This leads to the final column in the histograph below being a catch-all for any values above this point.

Can anyone suggest a method to help me smooth out this spike in the distribution please? Is it possible to estimate the distribution of this variable above this cut off point?

enter image description here

Source Link

How can I estimate the tail of a distribution?

The data I'm working with have all values over 30 placed into a >30 category. This leads to the final column in the histograph below being a catch-all for any values above this point.

Can anyone suggest a method to help me smooth out this spike in the distribution please? Is it possible to estimate the distribution of this variable above this cut off point?

enter image description here

Thank for your help,

Ed