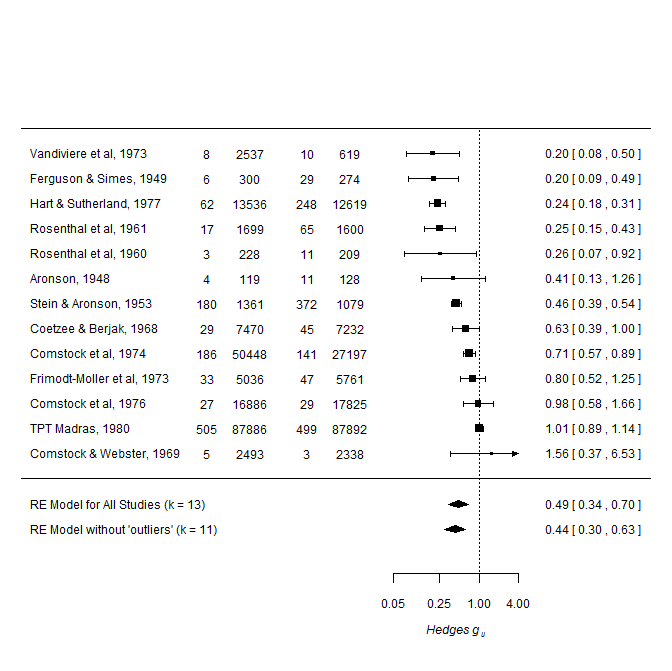
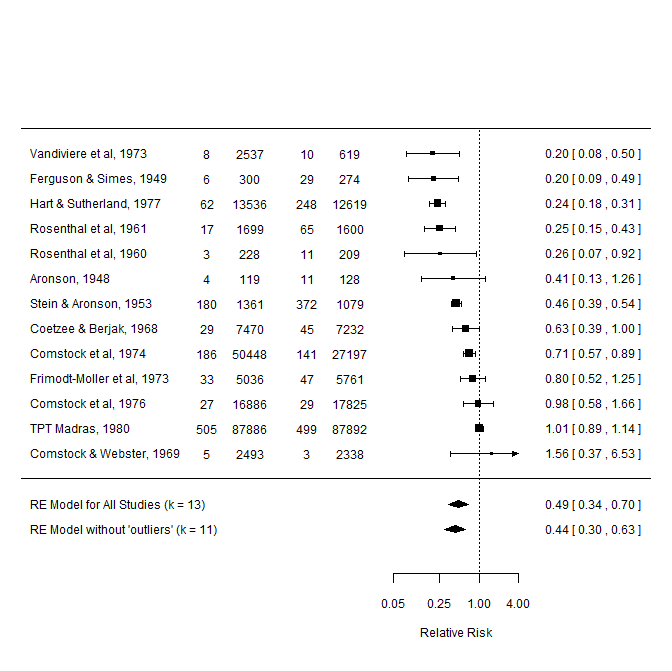
- Use
expression()to include subscripts etc.:xlab = expression("Hedges " * g[u]). - Use
italic()withinexpressionto get italic statistical terms:expression(italic("Hedges " * g[u])) - The proper alignment of the table seems tricky, I doubt there is a simple solution avaliable...
Here is an update of the R code and the plot:
library(metafor)

data(dat.bcg)

## REM (k = 13)
res <- rma(ai=tpos, bi=tneg, ci=cpos, di=cneg, data=dat.bcg, measure="RR",
           slab=paste(author, year, sep=", "), method="REML")

## REM (k = 11; 'outliers' removed)
res2 <- rma(ai=tpos, bi=tneg, ci=cpos, di=cneg, data=subset(dat.bcg, trial < 12),
            measure="RR", slab=paste(author, year, sep=", "), method="REML")

## Forest plot
forest(res, xlim=c(-16, 6), at=log(c(.05, .25, 1, 4)), atransf=exp,
       ilab=cbind(dat.bcg$tpos, dat.bcg$tneg, dat.bcg$cpos, dat.bcg$cneg),
       ilab.xpos=c(-9.5,-8,-6,-4.5), cex=.75, ylim=c(-3, 16),
       order="obs",xlab = expression(italic("Hedges " * g[u])), mlab="RE Model for All Studies (k = 13)")

## Add second summary effect size
addpoly(res2, atransf=exp, mlab="RE Model without 'outliers' (k = 11)", cex=.75)


