Since logarithm is only defined for positive numbers, you can't take the logarithm of negative values. However, if you are aiming at obtaining a better distribution for your data, you can apply the following transformation.
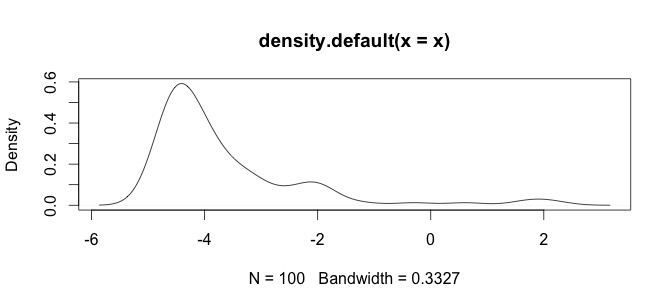
Suppose you have skewed negative data:
x <- rlnorm(n = 1e2, meanlog = 0, sdlog = 1)
x <- x - 5
plot(density(x))

then you can apply a first transformation to make your data lie in $[-1,1]$$(-1,1)$:
z <- (x - min(x)) / (max(x) - min(x)) * 2 - 1
z <- z[-min(z)]
z <- z[-max(z)]
min(z); max(z)
and finally apply the inverse hyperbolic tangent:
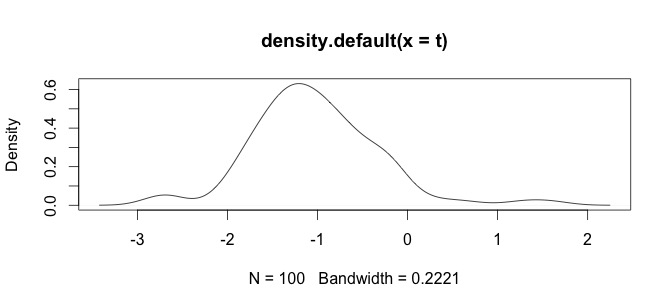
t <- atanh(z)
plot(density(t))
Now, your data look approximately normally distributed. This is also called Fisher transformation.

