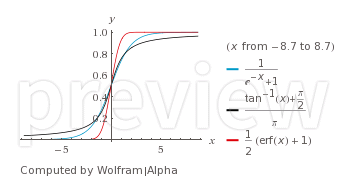
What is the interpretation of the number that is the output of the logistic regression function?
The logistic function
$$f(\vec{x}) = \frac{1}{1+e^{-g(\vec{x})}}$$
(where $g$ is a linear function) is supposed to map a continuous variable (or more generally a whole bunch of totally ordered variables) to between 0 and 1.
I've always assumed it is the probability of inclusion in one set or the other. The range is $[0,1]$ (well, maybe not 0 and 1), which is what a probability is. And frankly anything between 0 and 1, what else could it be other than a probability.
But looking at the curve, I started to doubt. I wondered if it is necessarily to be interpreted as a probability. It looks like a probability but is it really? Just because they share the same range doesn't mean they are the same. If $f(\vec{x}) = .75$, does that really mean that $75\%$ of $f$ is less than $f(\vec{x})$?
This could go in two directions:
Suppose it is a probability, or more exactly the probability of a 'true', '1', or 'positive' classification of a point in the domain. How is this justified?
Suppose not. Then what is it exactly and why? How far a way is it from a probability (numerically and conceptually)?
Another way to say this is what is so special about $1/(1+e^{-g(x)})$? Why not any monotonically increasing odd (about $y=1/2$) function with the same range, like $$f(x) = \frac{\tan^{-1}(g(x))+\pi/2}{\pi}$$ or $$f(x) = {\rm erf}(g(x)) = \frac{2}{\sqrt{\pi}} \int_{-\infty}^x e^{-t^2} \ {\rm d}t$$ (very close but not equal to the logistic function)
or frankly $$f(x) = \begin{array}{ll} 0,& {\rm if\ } g(x) < 0\\ 1,& {\rm if\ } g(x) >= 0 \end{array}$$ ?

