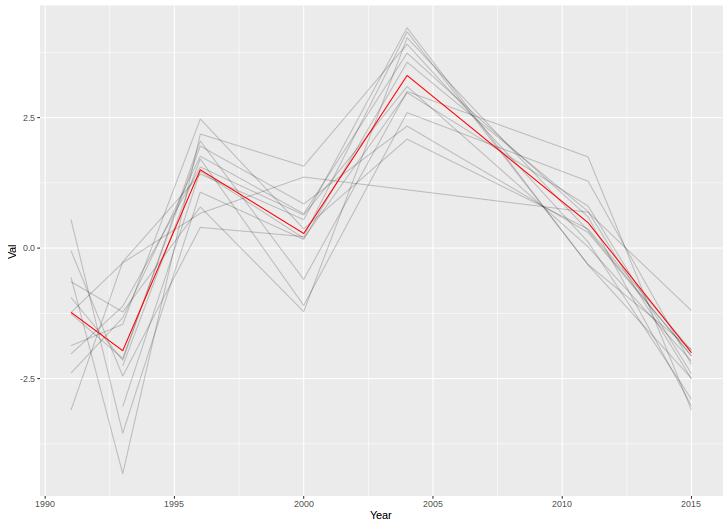
Here is a solution inspired by Ch. 11.3, the section on "Texas Housing Data", in Hadley Wickhams's Book on ggplot2. Here I fit a linear model to each time series , take the residuals (which are centered around mean 0), and draw a summary line in a different color.
library(ggplot2)
library(dplyr)
#works with dplyr version 0.4.3.9000 from Github (hadley/dplyr@4f2d7f8), or higher

df1 <- as.data.frame(list(Var = structure(c(1L, 2L, 2L, 2L, 2L, 2L, 2L,
                                 2L, 3L, 3L, 3L, 3L, 3L, 3L, 3L, 5L, 5L, 5L, 5L, 5L, 5L, 5L, 6L,
                                 6L, 6L, 6L, 6L, 6L, 7L, 7L, 7L, 7L, 7L, 7L, 7L, 8L, 8L, 8L, 8L,
                                 8L, 8L, 8L, 9L, 9L, 9L, 9L, 9L, 9L, 9L, 11L, 11L, 11L, 11L, 11L,
                                 11L, 11L, 12L, 12L, 12L, 12L, 12L, 12L, 13L, 14L, 14L, 14L, 14L,
                                 14L, 14L, 14L, 16L, 16L, 16L, 16L, 16L, 16L, 17L, 17L, 17L, 17L,
                                 17L, 17L, 17L, 18L, 18L, 18L, 18L, 18L, 18L, 18L), .Label = c("A",
                                                                                               "B", "C", "D", "E", "F", "G", "H", "I", "J", "K", "L", "M", "N",
                                                                                               "O", "P", "Q", "R", "S", "T", "U", "V", "W", "X", "Y", "Z"), class = "factor"),
               Year = c(2015L, 1991L, 1993L, 1996L, 2000L, 2004L, 2011L,
                        2015L, 1991L, 1993L, 1996L, 2000L, 2004L, 2011L, 2015L, 1991L,
                        1993L, 1996L, 2000L, 2004L, 2011L, 2015L, 1993L, 1996L, 2000L,
                        2004L, 2011L, 2015L, 1991L, 1993L, 1996L, 2000L, 2004L, 2011L,
                        2015L, 1991L, 1993L, 1996L, 2000L, 2004L, 2011L, 2015L, 1991L,
                        1993L, 1996L, 2000L, 2004L, 2011L, 2015L, 1991L, 1993L, 1996L,
                        2000L, 2004L, 2011L, 2015L, 1993L, 1996L, 2000L, 2004L, 2011L,
                        2015L, 2015L, 1991L, 1993L, 1996L, 2000L, 2004L, 2011L, 2015L,
                        1991L, 1993L, 1996L, 2000L, 2011L, 2015L, 1991L, 1993L, 1996L,
                        2000L, 2004L, 2011L, 2015L, 1991L, 1993L, 1996L, 2000L, 2004L,
                        2011L, 2015L),
               Val = c(25.6, 22.93, 20.82, 24.1, 24.5, 29,
                       25.55, 24.5, 24.52, 20.73, 25.8, 25.5, 29.5, 27.7, 25.1,
                       25, 24.55, 26.75, 25, 30.5, 27.25, 25.1, 22.4, 27.07, 26,
                       29, 27.2, 24.2, 23, 24.27, 27.68, 27, 30.5, 28.1, 24.9, 23.75,
                       22.75, 27.25, 25, 29, 28.45, 24, 20.25, 17.07, 24.45, 25,
                       28.5, 26.75, 24.9, 21.25, 20.65, 25.1, 24.5, 26.5, 25.35,
                       23.5, 21.93, 26.5, 24.5, 29, 29.1, 26.4, 28.1, 23.75, 26.5,
                       28.05, 27, 30.5, 25.65, 23.3, 23.25, 24.57, 26.07, 27.5,
                       28.85, 27.7, 22, 23.43, 26.88, 27, 30.5, 29.25, 28.1, 23,
                       23.8, 28.32, 27, 29.5, 29.15, 27.6)),
               row.names = c(1L, 4L,
                           5L, 6L, 7L, 8L, 9L, 10L, 13L, 14L, 15L, 16L, 17L, 18L, 19L, 20L,
                           21L, 22L, 23L, 24L, 25L, 26L, 27L, 28L, 29L, 30L, 31L, 32L, 35L,
                           36L, 37L, 38L, 39L, 40L, 41L, 44L, 45L, 46L, 47L, 48L, 49L, 50L,
                           53L, 54L, 55L, 56L, 57L, 58L, 59L, 62L, 63L, 64L, 65L, 66L, 67L,
                           68L, 69L, 70L, 71L, 72L, 73L, 74L, 75L, 78L, 79L, 80L, 81L, 82L,
                           83L, 84L, 87L, 88L, 89L, 90L, 91L, 92L, 95L, 96L, 97L, 98L, 99L,
                           100L, 101L, 104L, 105L, 106L, 107L, 108L, 109L, 110L),
               na.action = structure(c(2L,
                          3L, 11L, 12L, 33L, 34L, 42L, 43L, 51L, 52L, 60L, 61L, 76L, 77L,
                          85L, 86L, 93L, 94L, 102L, 103L),
                .Names = c("2", "3", "11", "12","33", "34", "42", "43", "51", "52", "60",
                           "61", "76", "77", "85", "86", "93", "94", "102", "103"), class = "omit"),
                class = "data.frame", .Names = c("Var","Year", "Val"))


df1 %>%
        group_by(Var) %>%
        do(mutate(.,resid = resid(lm(Val ~ Year, data=., na.action = na.exclude)))) %>%
        ggplot(aes(Year, resid)) +
        labs(y=paste0("Val "), x="Year") +
        geom_line(aes(group = Var), alpha = 1/5) +
        geom_line(stat = "summary", fun.y = "mean", colour = "red")


