added 52 characters in body; edited title
Source Link
el Josso
  • 548
  • 2
  • 16

When havecan I to stop looking for a better model?

When havecan I to stop looking for a better model?

I'm looking for a model between stockprices of energy and the weather. I have the price of the MWatt bought between the countries of Europe, and a lot of values on the weather (Grib files). Each hours on a period of 5 years (2011-2015).

Price/day

enter image description here

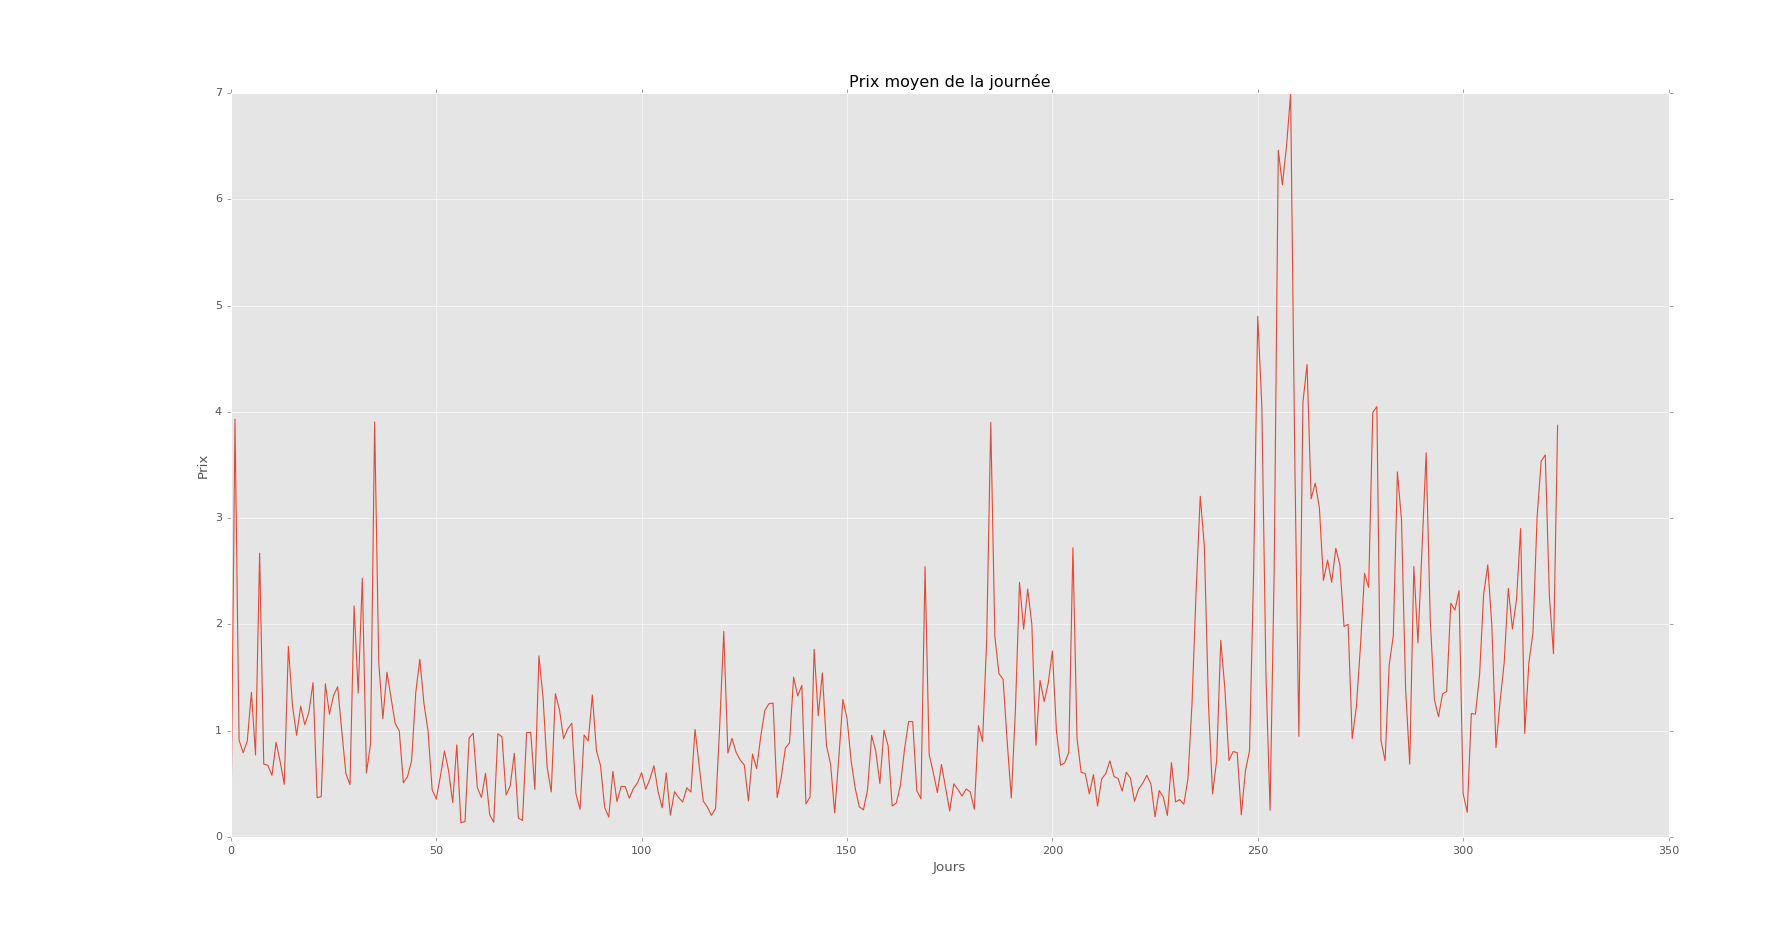
This is per day for one year. I have this per hours on 5 years.

Example of weather
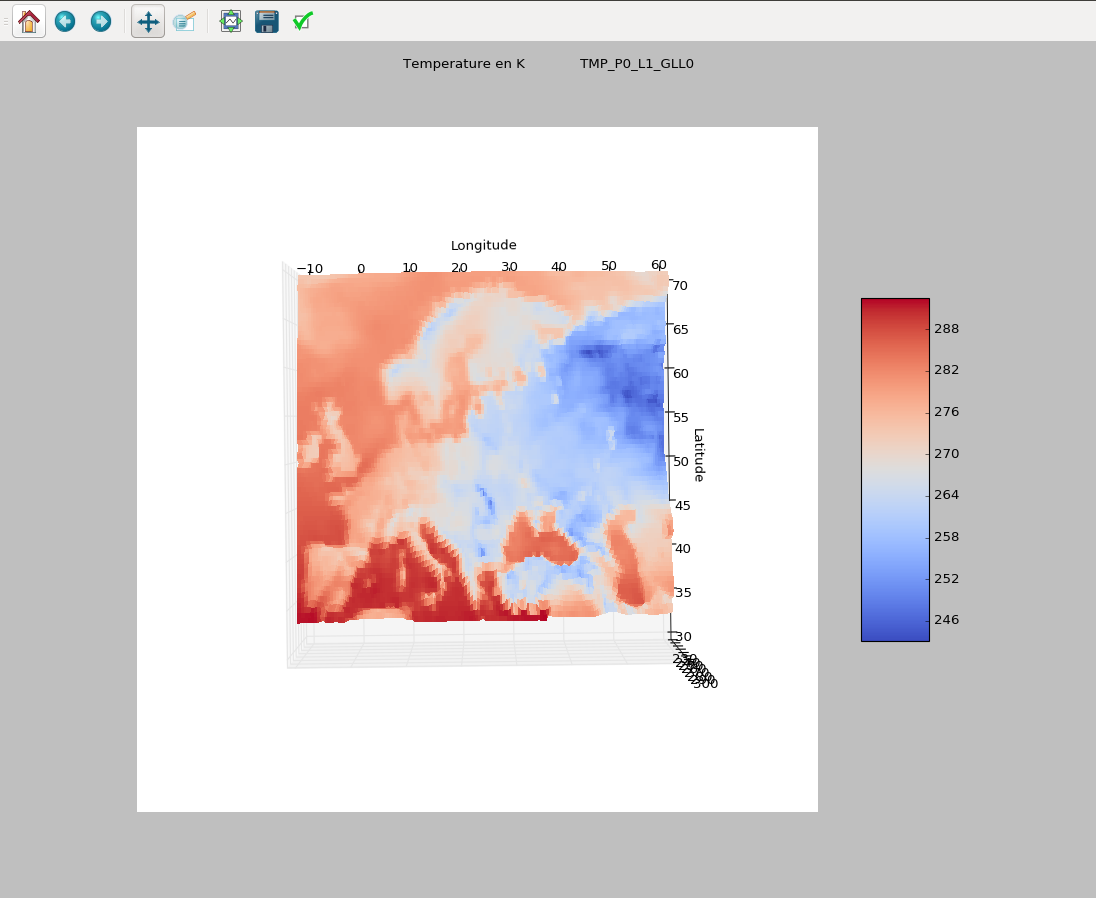
enter image description here 3Dscatterplot, in kelvin, for an hour. I have 1000 values per data per hour and 200 data, like klevin, wind, geopential etc..

I'm trying to forecast the mean price per hour of the Mwatt.

My data on the weather are very dense, more than 10000 values/hour and so with a high correlation. It's a problem of short,big data.

I've tried the Lasso, Ridge and SVR methods with the mean price of the MWatt as outcome and my weather's data as income. I took 70% as training data and 30% as test. If my test's data are non-forecasting (somwhere inside my training data) I have a good prediction( R² = 0.89). But i want to do forecasting on my data.

So if the test data are chronologically after my training data it doesn't predict anything (R²=0.05). I think it's normal because it's a time serie. And there is a lot of autocorrelation.

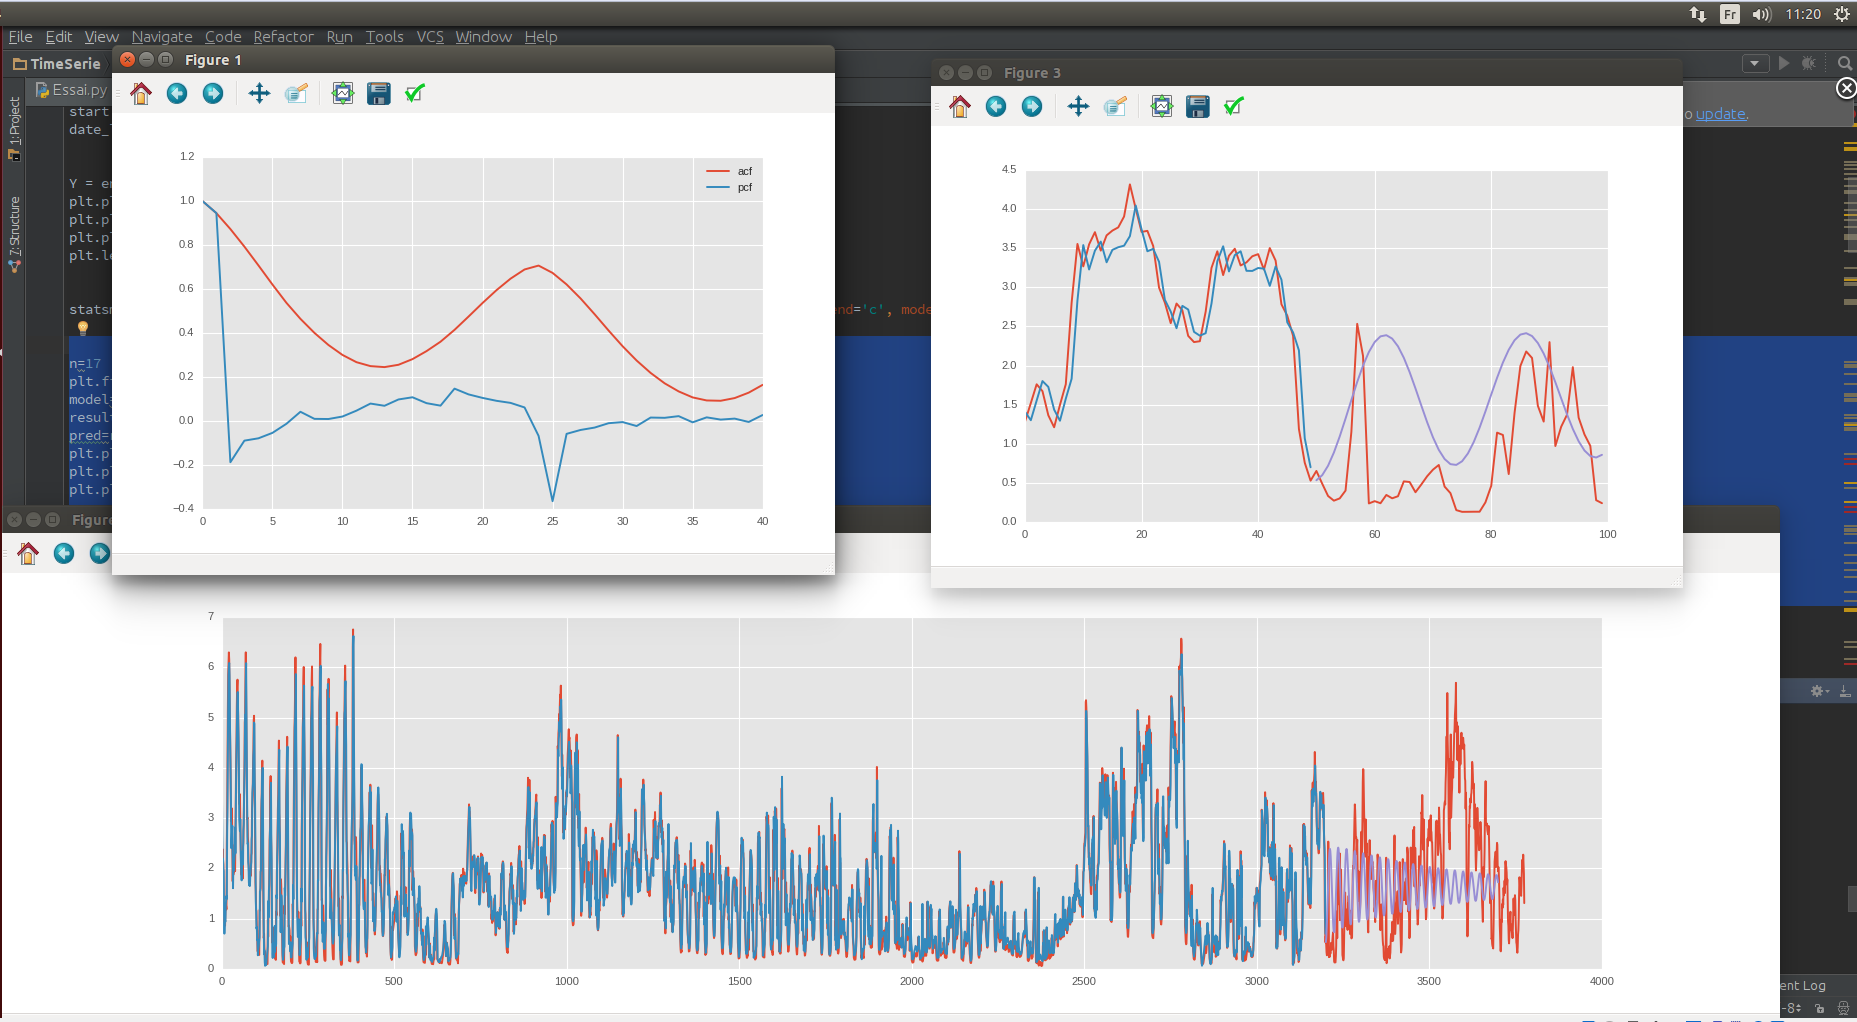
I thought that i had to use time serie model like ARIMA. I calculated the order of the method (the serie is stationary) and I tested it. But it doesn't work . I mean that the forecasting has a r² of 0.05.My prediction on the test data is not at all on my test data. I tried the ARIMAX method with my weather as regressor. Put it doesn't add any information.

ACF/PCF, Test/train data

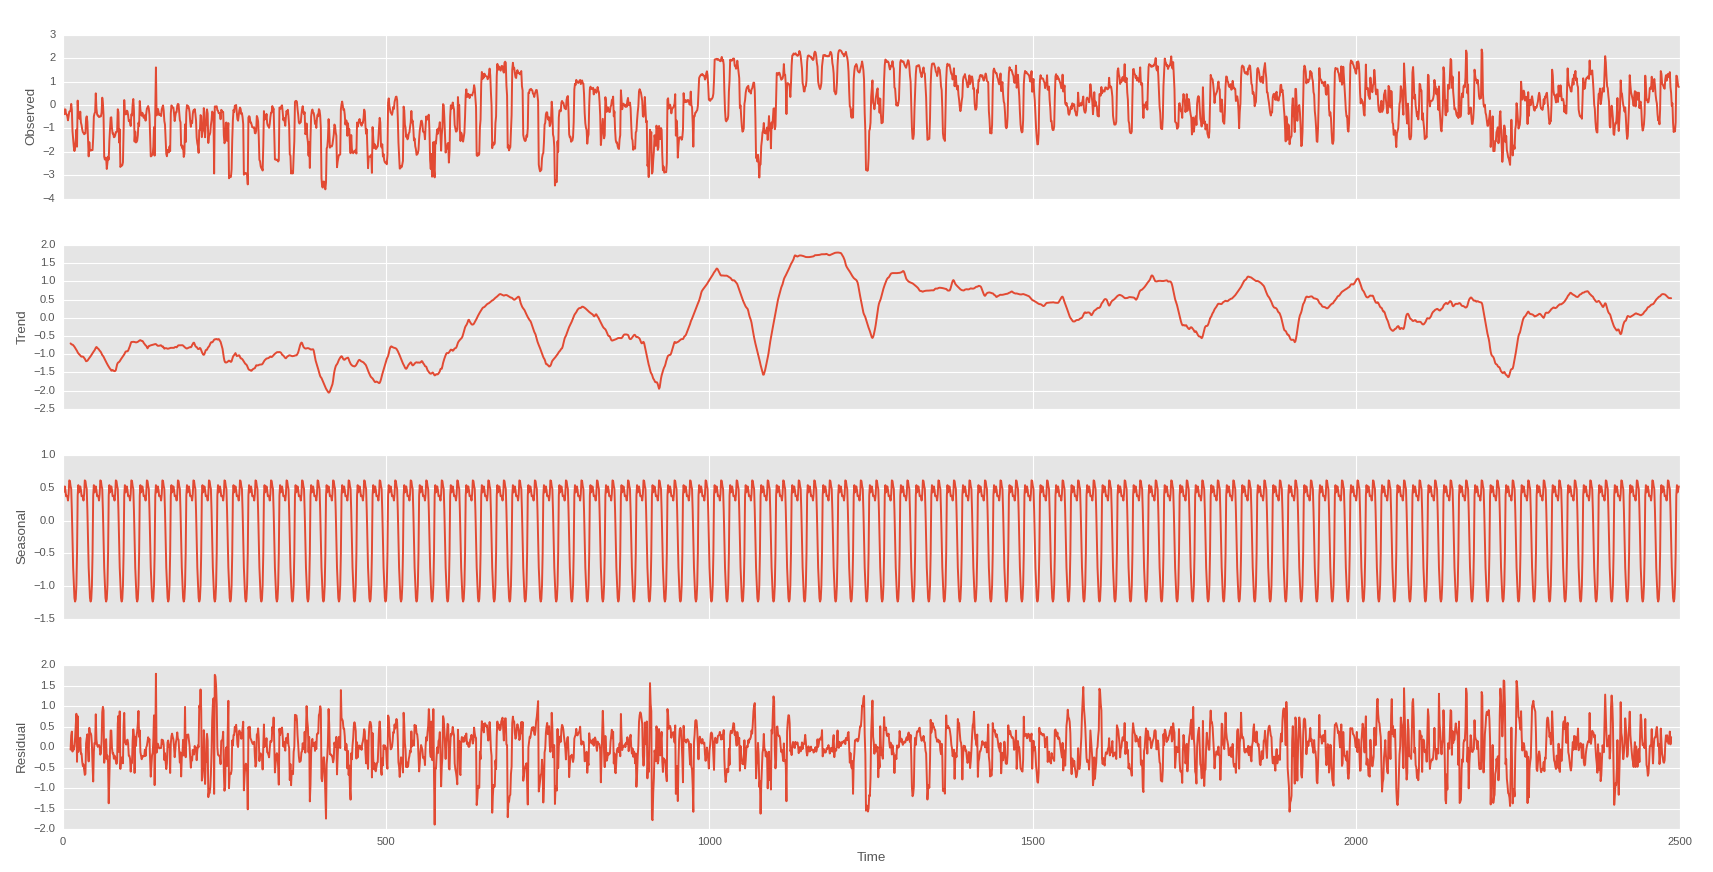
So I've done a seasonal cut per day and per week

Day

enter image description here

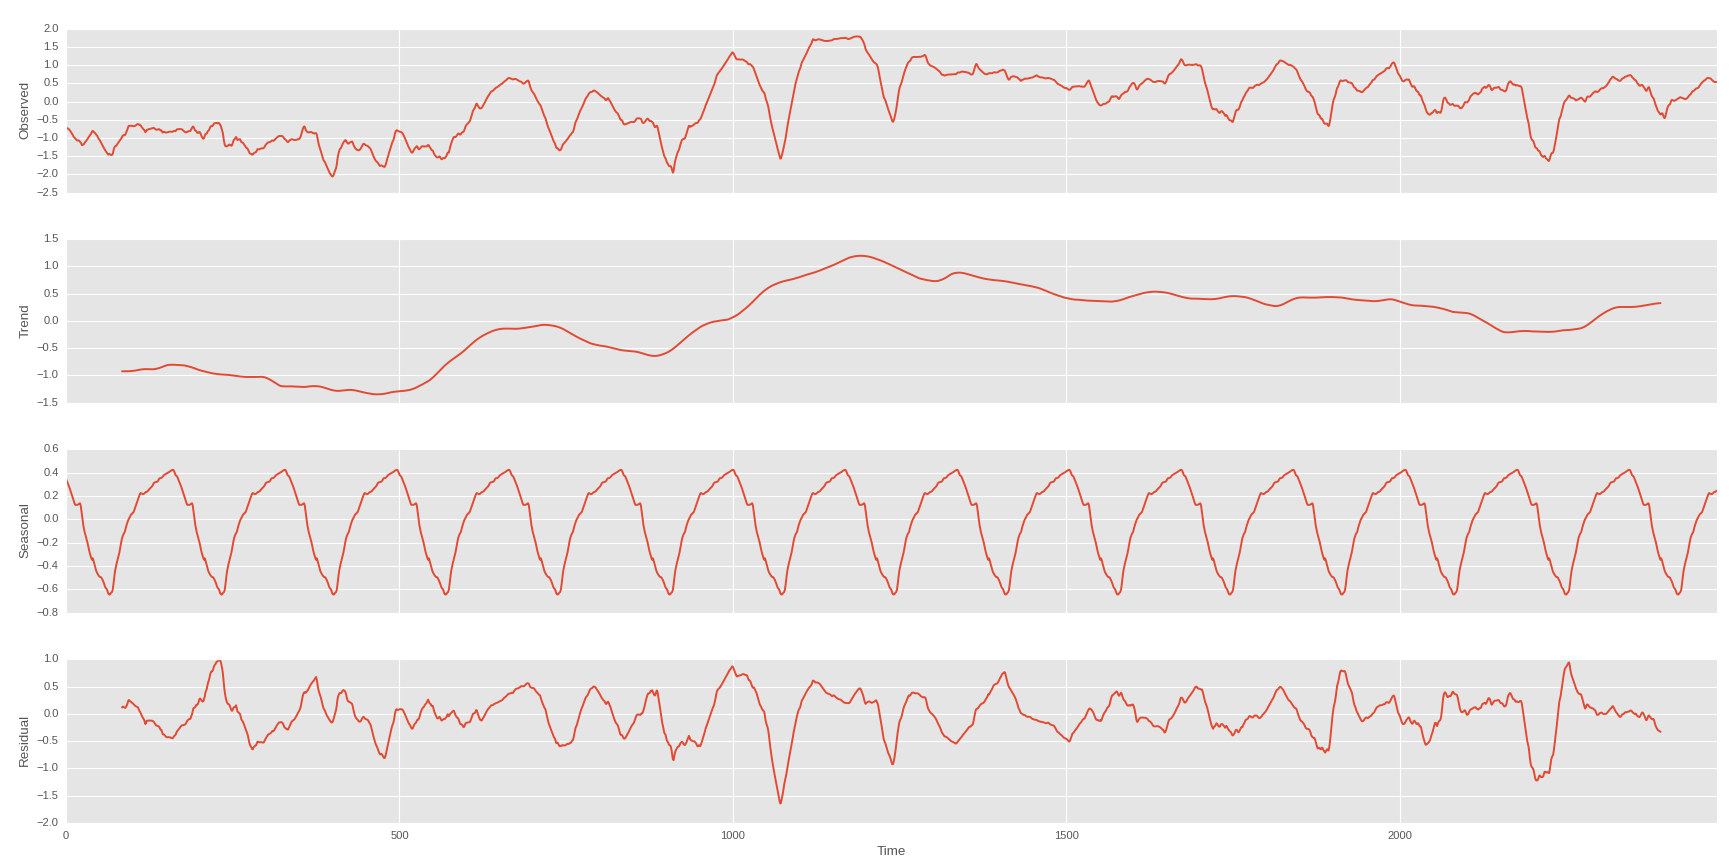
Week on the trend of the first

enter image description here

And I can have this if I can predecit the trend of trend of my stock price : enter image description here
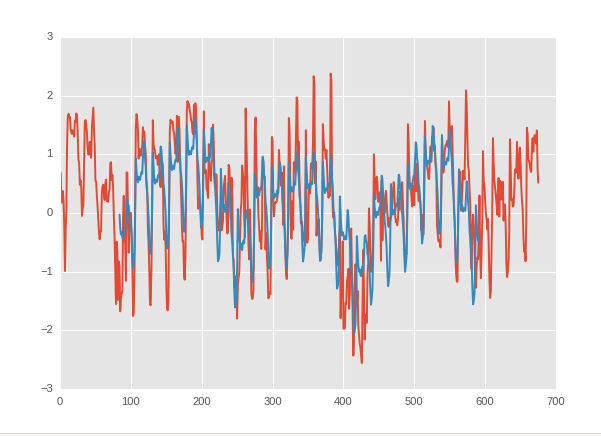
The blue is my prediction and the red the real value.

I'm going to do a regression with a rolling mean of the weather as income and the trend of the trend of the stockprice as outcome. But for now, I haven't find any relation.

But if there is no interaction, how can I know there isn't anything? maybe it's just that I haven't find it.

When have I to stop looking for a model?

I'm looking for a model between stockprices of energy and the weather. I have the price of the MWatt bought between the countries of Europe, and a lot of values on the weather (Grib files). Each hours on a period of 5 years (2011-2015).

Price/day

enter image description here

This is per day for one year. I have this per hours on 5 years.

Example of weather

enter image description here 3Dscatterplot, in kelvin, for an hour. I have 1000 values per data per hour and 200 data, like klevin, wind, geopential etc..

I'm trying to forecast the mean price per hour of the Mwatt.

My data on the weather are very dense, more than 10000 values/hour and so with a high correlation. It's a problem of short,big data.

I've tried the Lasso, Ridge and SVR methods with the mean price of the MWatt as outcome and my weather's data as income. I took 70% as training data and 30% as test. If my test's data are non-forecasting (somwhere inside my training data) I have a good prediction( R² = 0.89). But i want to do forecasting on my data.

So if the test data are chronologically after my training data it doesn't predict anything (R²=0.05). I think it's normal because it's a time serie. And there is a lot of autocorrelation.

I thought that i had to use time serie model like ARIMA. I calculated the order of the method (the serie is stationary) and I tested it. But it doesn't work . I mean that the forecasting has a r² of 0.05.My prediction on the test data is not at all on my test data. I tried the ARIMAX method with my weather as regressor. Put it doesn't add any information.

ACF/PCF, Test/train data

So I've done a seasonal cut per day and per week

Day

enter image description here

Week on the trend of the first

enter image description here

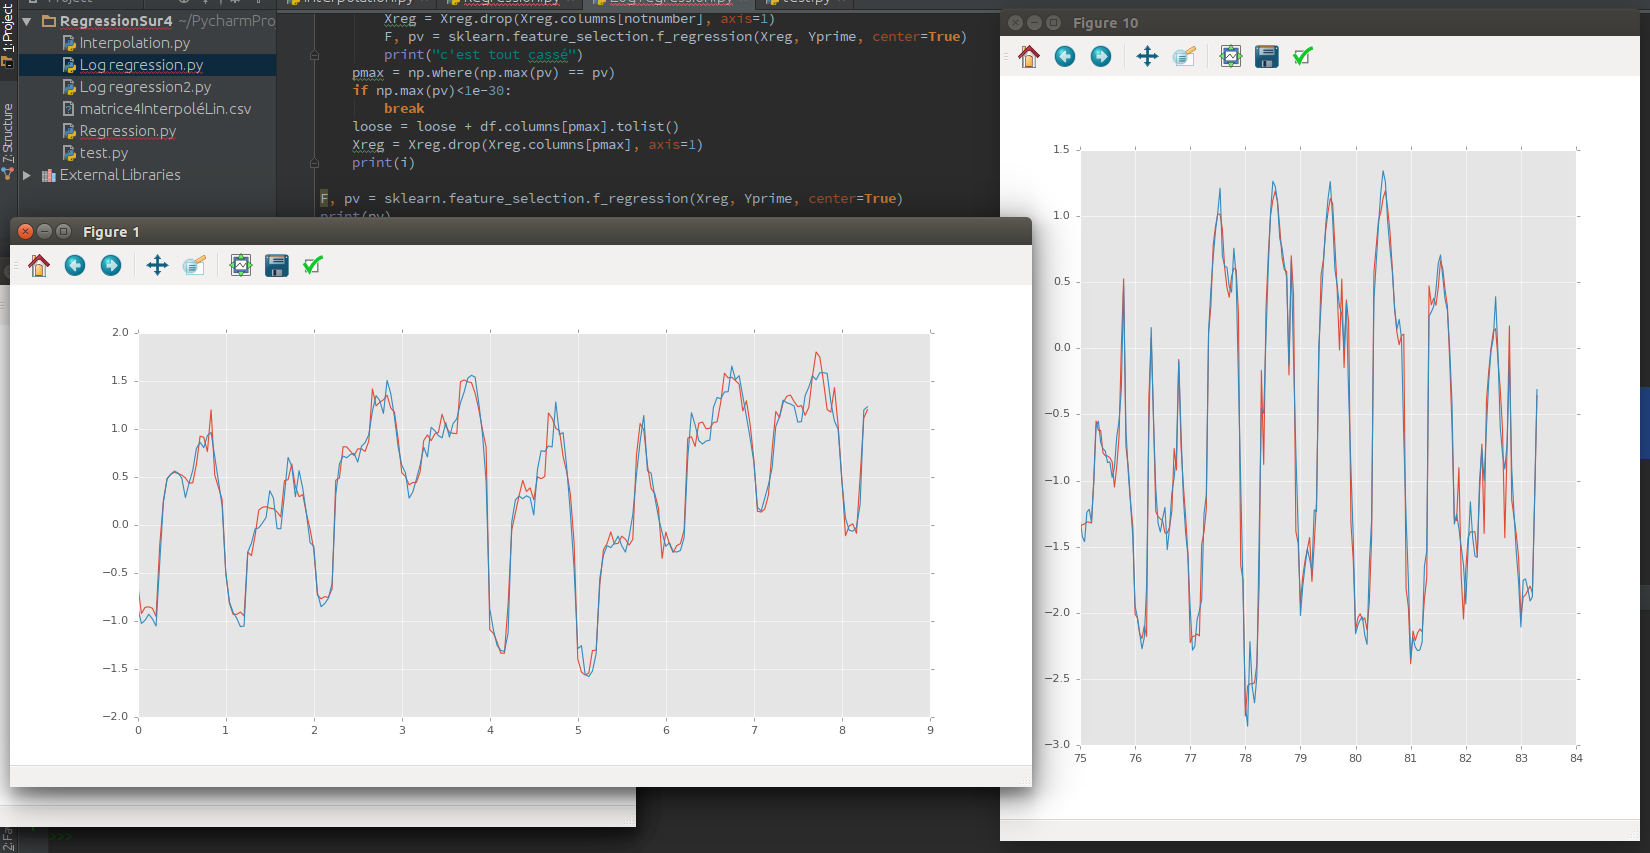
And I can have this if I can predecit the trend of trend of my stock price : enter image description here

The blue is my prediction and the red the real value.

I'm going to do a regression with a rolling mean of the weather as income and the trend of the trend of the stockprice as outcome. But for now, I haven't find any relation.

But if there is no interaction, how can I know there isn't anything? maybe it's just that I haven't find it.
When can I stop looking for a better model?

I'm looking for a model between stockprices of energy and the weather. I have the price of the MWatt bought between the countries of Europe, and a lot of values on the weather (Grib files). Each hours on a period of 5 years (2011-2015).

Price/day

enter image description here

This is per day for one year. I have this per hours on 5 years.

Example of weather

enter image description here 3Dscatterplot, in kelvin, for an hour. I have 1000 values per data per hour and 200 data, like klevin, wind, geopential etc..

I'm trying to forecast the mean price per hour of the Mwatt.

My data on the weather are very dense, more than 10000 values/hour and so with a high correlation. It's a problem of short,big data.

I've tried the Lasso, Ridge and SVR methods with the mean price of the MWatt as outcome and my weather's data as income. I took 70% as training data and 30% as test. If my test's data are non-forecasting (somwhere inside my training data) I have a good prediction( R² = 0.89). But i want to do forecasting on my data.

So if the test data are chronologically after my training data it doesn't predict anything (R²=0.05). I think it's normal because it's a time serie. And there is a lot of autocorrelation.

I thought that i had to use time serie model like ARIMA. I calculated the order of the method (the serie is stationary) and I tested it. But it doesn't work . I mean that the forecasting has a r² of 0.05.My prediction on the test data is not at all on my test data. I tried the ARIMAX method with my weather as regressor. Put it doesn't add any information.

ACF/PCF, Test/train data

So I've done a seasonal cut per day and per week

Day

enter image description here

Week on the trend of the first

enter image description here

And I can have this if I can predecit the trend of trend of my stock price : enter image description here

The blue is my prediction and the red the real value.

I'm going to do a regression with a rolling mean of the weather as income and the trend of the trend of the stockprice as outcome. But for now, I haven't find any relation.

But if there is no interaction, how can I know there isn't anything? maybe it's just that I haven't find it.
Commonmark migration
Source Link

I'm looking for a model between stockprices of energy and the weather. I have the price of the MWatt bought between the countries of Europe, and a lot of values on the weather (Grib files). Each hours on a period of 5 years (2011-2015).

Price/day

enter image description here

This is per day for one year. I have this per hours on 5 years.

Example of weather

enter image description here 3Dscatterplot, in kelvin, for an hour. I have 1000 values per data per hour and 200 data, like klevin, wind, geopential etc..

I'm trying to forecast the mean price per hour of the Mwatt.

My data on the weather are very dense, more than 10000 values/hour and so with a high correlation. It's a problem of short,big data.

I've tried the Lasso, Ridge and SVR methods with the mean price of the MWatt as outcome and my weather's data as income. I took 70% as training data and 30% as test. If my test's data are non-forecasting (somwhere inside my training data) I have a good prediction( R² = 0.89). But i want to do forecasting on my data.

So if the test data are chronologically after my training data it doesn't predict anything (R²=0.05). I think it's normal because it's a time serie. And there is a lot of autocorrelation.

I thought that i had to use time serie model like ARIMA. I calculated the order of the method (the serie is stationary) and I tested it. But it doesn't work . I mean that the forecasting has a r² of 0.05.My prediction on the test data is not at all on my test data. I tried the ARIMAX method with my weather as regressor. Put it doesn't add any information.

##ACF/PCF, Test/train data

ACF/PCF, Test/train data

So I've done a seasonal cut per day and per week

Day

##Day enter image description here ##Week on the trend of the first

Week on the trend of the first

enter image description here

And I can have this if I can predecit the trend of trend of my stock price : enter image description here

The blue is my prediction and the red the real value.

I'm going to do a regression with a rolling mean of the weather as income and the trend of the trend of the stockprice as outcome. But for now, I haven't find any relation.

But if there is no interaction, how can I know there isn't anything? maybe it's just that I haven't find it.
I'm looking for a model between stockprices of energy and the weather. I have the price of the MWatt bought between the countries of Europe, and a lot of values on the weather (Grib files). Each hours on a period of 5 years (2011-2015).

Price/day

enter image description here

This is per day for one year. I have this per hours on 5 years.

Example of weather

enter image description here 3Dscatterplot, in kelvin, for an hour. I have 1000 values per data per hour and 200 data, like klevin, wind, geopential etc..

I'm trying to forecast the mean price per hour of the Mwatt.

My data on the weather are very dense, more than 10000 values/hour and so with a high correlation. It's a problem of short,big data.

I've tried the Lasso, Ridge and SVR methods with the mean price of the MWatt as outcome and my weather's data as income. I took 70% as training data and 30% as test. If my test's data are non-forecasting (somwhere inside my training data) I have a good prediction( R² = 0.89). But i want to do forecasting on my data.

So if the test data are chronologically after my training data it doesn't predict anything (R²=0.05). I think it's normal because it's a time serie. And there is a lot of autocorrelation.

I thought that i had to use time serie model like ARIMA. I calculated the order of the method (the serie is stationary) and I tested it. But it doesn't work . I mean that the forecasting has a r² of 0.05.My prediction on the test data is not at all on my test data. I tried the ARIMAX method with my weather as regressor. Put it doesn't add any information.

##ACF/PCF, Test/train data

So I've done a seasonal cut per day and per week

##Day enter image description here ##Week on the trend of the first enter image description here

And I can have this if I can predecit the trend of trend of my stock price : enter image description here

The blue is my prediction and the red the real value.

I'm going to do a regression with a rolling mean of the weather as income and the trend of the trend of the stockprice as outcome. But for now, I haven't find any relation.

But if there is no interaction, how can I know there isn't anything? maybe it's just that I haven't find it.
I'm looking for a model between stockprices of energy and the weather. I have the price of the MWatt bought between the countries of Europe, and a lot of values on the weather (Grib files). Each hours on a period of 5 years (2011-2015).

Price/day

enter image description here

This is per day for one year. I have this per hours on 5 years.

Example of weather

enter image description here 3Dscatterplot, in kelvin, for an hour. I have 1000 values per data per hour and 200 data, like klevin, wind, geopential etc..

I'm trying to forecast the mean price per hour of the Mwatt.

My data on the weather are very dense, more than 10000 values/hour and so with a high correlation. It's a problem of short,big data.

I've tried the Lasso, Ridge and SVR methods with the mean price of the MWatt as outcome and my weather's data as income. I took 70% as training data and 30% as test. If my test's data are non-forecasting (somwhere inside my training data) I have a good prediction( R² = 0.89). But i want to do forecasting on my data.

So if the test data are chronologically after my training data it doesn't predict anything (R²=0.05). I think it's normal because it's a time serie. And there is a lot of autocorrelation.

I thought that i had to use time serie model like ARIMA. I calculated the order of the method (the serie is stationary) and I tested it. But it doesn't work . I mean that the forecasting has a r² of 0.05.My prediction on the test data is not at all on my test data. I tried the ARIMAX method with my weather as regressor. Put it doesn't add any information.

ACF/PCF, Test/train data

So I've done a seasonal cut per day and per week

Day

enter image description here

Week on the trend of the first

enter image description here

And I can have this if I can predecit the trend of trend of my stock price : enter image description here

The blue is my prediction and the red the real value.

I'm going to do a regression with a rolling mean of the weather as income and the trend of the trend of the stockprice as outcome. But for now, I haven't find any relation.

But if there is no interaction, how can I know there isn't anything? maybe it's just that I haven't find it.

added 7 characters in body
Source Link
el Josso
  • 548
  • 2
  • 16

I'm looking for a model between stockprices of energy and the weather. I have the price of the MWatt bought between the countries of Europe, and a lot of values on the weather (Grib files). Each hours on a period of 5 years (2011-2015).

Price/day

enter image description here

This is per day for one year. I have this per hours on 5 years.

Example of weather

enter image description here 3Dscatterplot, in kelvin, for an hour. I have 1000 values per data per hour and 200 data, like klevin, wind, geopential etc..

I'm trying to forecast the mean price per hour of the Mwatt.

My data on the weather are very dense, more than 10000 values/hour and so with a high correlation. It's a problem of short,big data.

I've tried the Lasso, Ridge and SVR methods with the mean price of the MWatt as outcome and my weather's data as income. I took 70% as training data and 30% as test. If my test's data are non-forecasting (somwhere inside my training data) I have a good prediction( R² = 0.89). But i want to do forecasting on my data.

So if the test data are chronologically after my training data it doesn't predict anything (R²=0.05). I think it's normal because it's a time serie. And there is a lot of autocorrelation.

I thought that i had to use time serie model like ARIMA. I calculated the order of the method (the serie is stationary) and I tested it. But it doesn't work . I mean that the forecasting has a r² of 0.05.My prediction on the test data is not at all on my test data. I tried the ARIMAX method with my weather as regressor. Put it doesn't add any information.

##ACF/PCF, Test/train data

So I've done a seasonal cut per day and per week

##Day enter image description here ##Week on the trend of the first enter image description here

And I can have this if I can predecit the trend of trend of my stock price : enter image description here

The blue is my prediction and the red the real value.

I'm going to do a regression with a rolling mean of the weather as income and the trend of the trend of the stockprice as outcome. But for now, I haven't find any relation. But for now, I haven't find any relation.

But if there is no interaction, how can I know there isn't anything? maybe it's just that I haven't find itBut if there is no interaction, how can I know there isn't anything? maybe it's just that I haven't find it.

I'm looking for a model between stockprices of energy and the weather. I have the price of the MWatt bought between the countries of Europe, and a lot of values on the weather (Grib files). Each hours on a period of 5 years (2011-2015).

Price/day

enter image description here

This is per day for one year. I have this per hours on 5 years.

Example of weather

enter image description here 3Dscatterplot, in kelvin, for an hour. I have 1000 values per data per hour and 200 data, like klevin, wind, geopential etc..

I'm trying to forecast the mean price per hour of the Mwatt.

My data on the weather are very dense, more than 10000 values/hour and so with a high correlation. It's a problem of short,big data.

I've tried the Lasso, Ridge and SVR methods with the mean price of the MWatt as outcome and my weather's data as income. I took 70% as training data and 30% as test. If my test's data are non-forecasting (somwhere inside my training data) I have a good prediction( R² = 0.89). But i want to do forecasting on my data.

So if the test data are chronologically after my training data it doesn't predict anything (R²=0.05). I think it's normal because it's a time serie. And there is a lot of autocorrelation.

I thought that i had to use time serie model like ARIMA. I calculated the order of the method (the serie is stationary) and I tested it. But it doesn't work . I mean that the forecasting has a r² of 0.05.My prediction on the test data is not at all on my test data. I tried the ARIMAX method with my weather as regressor. Put it doesn't add any information.

##ACF/PCF, Test/train data

So I've done a seasonal cut per day and per week

##Day enter image description here ##Week enter image description here

And I can have this if I can predecit the trend of trend of my stock price : enter image description here

The blue is my prediction and the red the real value.

I'm going to do a regression with a rolling mean of the weather as income and the trend of the trend of the stockprice as outcome. But for now, I haven't find any relation.

But if there is no interaction, how can I know there isn't anything? maybe it's just that I haven't find it

I'm looking for a model between stockprices of energy and the weather. I have the price of the MWatt bought between the countries of Europe, and a lot of values on the weather (Grib files). Each hours on a period of 5 years (2011-2015).

Price/day

enter image description here

This is per day for one year. I have this per hours on 5 years.

Example of weather

enter image description here 3Dscatterplot, in kelvin, for an hour. I have 1000 values per data per hour and 200 data, like klevin, wind, geopential etc..

I'm trying to forecast the mean price per hour of the Mwatt.

My data on the weather are very dense, more than 10000 values/hour and so with a high correlation. It's a problem of short,big data.

I've tried the Lasso, Ridge and SVR methods with the mean price of the MWatt as outcome and my weather's data as income. I took 70% as training data and 30% as test. If my test's data are non-forecasting (somwhere inside my training data) I have a good prediction( R² = 0.89). But i want to do forecasting on my data.

So if the test data are chronologically after my training data it doesn't predict anything (R²=0.05). I think it's normal because it's a time serie. And there is a lot of autocorrelation.

I thought that i had to use time serie model like ARIMA. I calculated the order of the method (the serie is stationary) and I tested it. But it doesn't work . I mean that the forecasting has a r² of 0.05.My prediction on the test data is not at all on my test data. I tried the ARIMAX method with my weather as regressor. Put it doesn't add any information.

##ACF/PCF, Test/train data

So I've done a seasonal cut per day and per week

##Day enter image description here ##Week on the trend of the first enter image description here

And I can have this if I can predecit the trend of trend of my stock price : enter image description here

The blue is my prediction and the red the real value.

I'm going to do a regression with a rolling mean of the weather as income and the trend of the trend of the stockprice as outcome. But for now, I haven't find any relation.

But if there is no interaction, how can I know there isn't anything? maybe it's just that I haven't find it.

added 2 characters in body
Source Link
el Josso
  • 548
  • 2
  • 16
Loading
added 553 characters in body
Source Link
el Josso
  • 548
  • 2
  • 16
Loading
added 424 characters in body
Source Link
el Josso
  • 548
  • 2
  • 16
Loading
added 32 characters in body
Source Link
el Josso
  • 548
  • 2
  • 16
Loading
added 409 characters in body
Source Link
el Josso
  • 548
  • 2
  • 16
Loading
added 1 character in body
Source Link
el Josso
  • 548
  • 2
  • 16
Loading
added 964 characters in body; edited tags
Source Link
el Josso
  • 548
  • 2
  • 16
Loading
Source Link
el Josso
  • 548
  • 2
  • 16
Loading