added 603 characters in body
Source Link
im7
  • 163
  • 4

In marketing segmentation studies which define clusters of consumers, categorical variables are often used to capture demographic and phychographic features, such as educational level, location, preferences, behaviors etc. So, in practice seemingly it makes sense to use categorical variables to cluster examples.

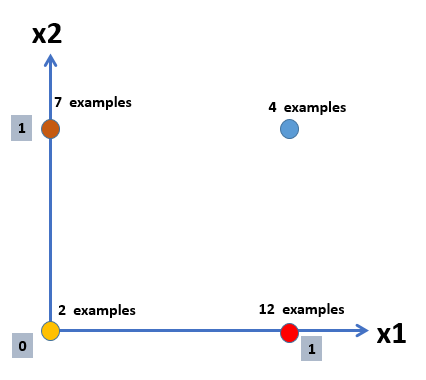
Let's use a very simple example for illustration purposes: Assume we define two events in a Web Analytics application: a) Download a PDF file (variable x1) and b) Sign in to the website (variable x2). Then let's assume that we have a distribution of examples as in the figure below:

enter image description here

In the above example, there is an intuitive way to cluster the observations: The 0–0 combination represents the less engaged users which form a cluster in themselves. The 1–0 and 0–1 combinations represent users somehow engaged to the website - and represent a second cluster. The 1–1 combination constitute the most engaged users and represent a third cluster. On the other hand, the Euclidean distance between combinations 0–1 and 1–0 which intuitively belong to the same cluster is larger than the lengths of the edges of the hypercube of possible combinations. Thus Euclidean distance does not seem a good metric in this case.

The question remains how we should perceive, interpret and explain distance and clustering when dealing with categorical dimensions and unlabeled data.

(Unsupervised clustering of unlabeled data is based on the premise that distance reveals patterns and that examples that are close together in the feature space and farther apart from other examples should be conceived as clusters. While this makes intuitive sense in a space of continuous features where Euclidean distance is relevant it is less intuitively apparent in a space formed by categorical binary features where the euclidean distance does not have a clear intuitive meaning. Then the question is, on what basis we perform clustering in such a space and what is the intuition behind it.)

In marketing segmentation studies which define clusters of consumers, categorical variables are often used to capture demographic and phychographic features, such as educational level, location, preferences, behaviors etc. So, in practice seemingly it makes sense to use categorical variables to cluster examples.

Let's use a very simple example for illustration purposes: Assume we define two events in a Web Analytics application: a) Download a PDF file (variable x1) and b) Sign in to the website (variable x2). Then let's assume that we have a distribution of examples as in the figure below:

enter image description here

In the above example, there is an intuitive way to cluster the observations: The 0–0 combination represents the less engaged users which form a cluster in themselves. The 1–0 and 0–1 combinations represent users somehow engaged to the website - and represent a second cluster. The 1–1 combination constitute the most engaged users and represent a third cluster. On the other hand, the Euclidean distance between combinations 0–1 and 1–0 which intuitively belong to the same cluster is larger than the lengths of the edges of the hypercube of possible combinations. Thus Euclidean distance does not seem a good metric in this case.

The question remains how we should perceive, interpret and explain distance and clustering when dealing with categorical dimensions and unlabeled data.

(Unsupervised clustering of unlabeled data is based on the premise that distance reveals patterns and that examples that are close together in the feature space and farther apart from other examples should be conceived as clusters. While this makes intuitive sense in a space of continuous features where Euclidean distance is relevant it is less intuitively apparent in a space formed by categorical binary features where the euclidean distance does not have a clear intuitive meaning. Then the question is, on what basis we perform clustering in such a space and what is the intuition behind it.)

Source Link
im7
  • 163
  • 4

What is the intuition behind distance and clustering in a space formed by categorical variables?

In marketing segmentation studies which define clusters of consumers, categorical variables are often used to capture demographic and phychographic features, such as educational level, location, preferences, behaviors etc. So, in practice seemingly it makes sense to use categorical variables to cluster examples.

Let's use a very simple example for illustration purposes: Assume we define two events in a Web Analytics application: a) Download a PDF file (variable x1) and b) Sign in to the website (variable x2). Then let's assume that we have a distribution of examples as in the figure below:

enter image description here

In the above example, there is an intuitive way to cluster the observations: The 0–0 combination represents the less engaged users which form a cluster in themselves. The 1–0 and 0–1 combinations represent users somehow engaged to the website - and represent a second cluster. The 1–1 combination constitute the most engaged users and represent a third cluster. On the other hand, the Euclidean distance between combinations 0–1 and 1–0 which intuitively belong to the same cluster is larger than the lengths of the edges of the hypercube of possible combinations. Thus Euclidean distance does not seem a good metric in this case.

The question remains how we should perceive, interpret and explain distance and clustering when dealing with categorical dimensions and unlabeled data.