added 2201 characters in body
Source Link
Jeremy Miles
  • 19k
  • 6
  • 46
  • 82

Edit (2): I ran logistic regression models in R to see how well each predicted the output. tl/dr: there's nothing between them.

Here's my code:

d <- read.csv("Copy of Cancer data - Weightings.csv")

mrc <- glm(cancer ~ weightrc, data = d, family = "binomial")
mun <- glm(cancer ~ unweight, data = d, family = "binomial")
mca <- glm(cancer ~ weightca, data = d, family = "binomial")
mic <- glm(cancer ~ weightic, data = d, family = "binomial")

d$prc <- predict(mrc, type = "response")
d$pun <- predict(mun, type = "response")
d$pca <- predict(mca, type = "response")
d$pic <- predict(mic, type = "response")

par(mfrow = c(2, 2))
roc(d$cancer, d$prc, ci = TRUE, plot = TRUE)
roc(d$cancer, d$pun, ci = TRUE, plot = TRUE)
roc(d$cancer, d$pca, ci = TRUE, plot = TRUE)
roc(d$cancer, d$pic, ci = TRUE, plot = TRUE)

4 ROC curves

And the output:

> par(mfrow = c(2, 2))
> roc(d$cancer, d$prc, ci = TRUE, plot = TRUE)

Call:
roc.default(response = d$cancer, predictor = d$prc, ci = TRUE,     plot = TRUE)

Data: d$prc in 81 controls (d$cancer 0) < 27 cases (d$cancer 1).
Area under the curve: 0.9831
95% CI: 0.9637-1 (DeLong)
> roc(d$cancer, d$pun, ci = TRUE, plot = TRUE)

Call:
roc.default(response = d$cancer, predictor = d$pun, ci = TRUE,     plot = TRUE)

Data: d$pun in 81 controls (d$cancer 0) < 27 cases (d$cancer 1).
Area under the curve: 0.9808
95% CI: 0.9602-1 (DeLong)
> roc(d$cancer, d$pca, ci = TRUE, plot = TRUE)

Call:
roc.default(response = d$cancer, predictor = d$pca, ci = TRUE,     plot = TRUE)

Data: d$pca in 81 controls (d$cancer 0) < 27 cases (d$cancer 1).
Area under the curve: 0.9854
95% CI: 0.9688-1 (DeLong)
> roc(d$cancer, d$pic, ci = TRUE, plot = TRUE)

Call:
roc.default(response = d$cancer, predictor = d$pic, ci = TRUE,     plot = TRUE)

Data: d$pic in 81 controls (d$cancer 0) < 27 cases (d$cancer 1).
Area under the curve: 0.9822
95% CI: 0.9623-1 (DeLong)
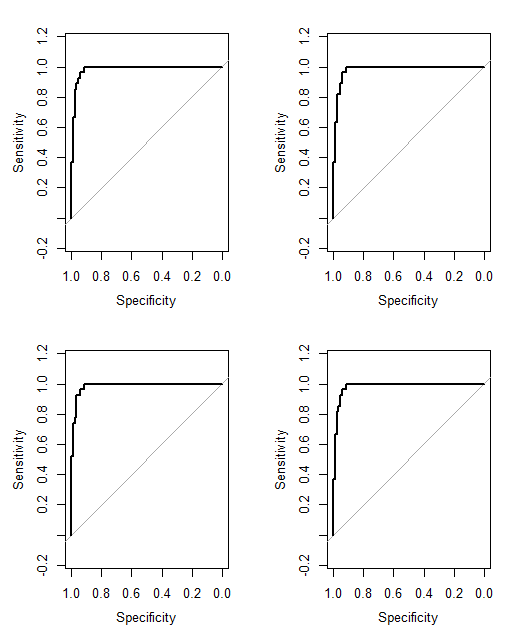
Added info based on OPs additional edits.
Source Link
Jeremy Miles
  • 19k
  • 6
  • 46
  • 82

First, I would see if the doctors agree with each other. You can't analyze 50 doctors separately, because you'll overfit the model - one doctor will look great, by chance.

You might try to combine confidence and diagnosis into a 10 point scale. If a doctors says that the patient doesn't have cancer, and they are very confident, that's a 0. If the doc says they do have cancer and they are very confident, that's a 9. If they doc says they don't, and are not confident, that's a 5, etc.

When you're trying to predict, you do some sort of regression analysis, but thinking about the causal ordering of these variables, it's the other way around. Whether the patient has cancer is the cause of the diagnosis, the outcome is the diagnosis.

Your rows should be patients, and your columns should be doctors. You now have a situation that's common in psychometrics (which is why I added the tag).

Then look at the relationships between the scores. Each patient has a mean score, and a score from each doctor. Does the mean score correlate positively with every doctor's score? If not, that doctor is probably not trustworthy (this is called the item-total correlation). Sometimes you remove one doctor from the total score (or mean score) and see if that doctor correlates with the mean of all the other doctors - this is the corrected item total correlation.

You could calculate Cronbach's alpha (which is a form of intra-class correlation), and the alpha without each doctor. Alpha should always rise when you add a doctor, so if it rises when you remove a doctor, that doctor's rating is suspect (this doesn't often tell you anything different from the corrected item-total correlation).

If you use R, this sort of thing is available in the psych package, using the function alpha. If you use Stata, the command is alpha, in SAS it's proc corr, and in SPSS it's under scale, reliability.

Then you can calculate a score, as the mean score from each doctor, or the weighted mean (weighted by the correlation) and see if that score is predictive of the true diagnosis.

Or you could skip that stage, and regress each doctor's score on diagnosis separately, and treat the regression parameters as weights.

Feel free to ask for clarification, and if you want a book, I like Streiner and Norman's "Health Measurement Scales".

-Edit: based on OPs additional info.

Wow, that's a heck of a Cronbach's alpha. The only time I've seen it that high is when a mistake was made.

I would now do logistic regression and look at the ROC curves.

The difference between weighting by regression and correlation depends on how you believe the doctors are responding. Some docs might be generally more confident (without being more skillful), and hence they might use the extreme ranges more. If you want to correct for that, using correlation, rather than regression, does that. I would probably weight by regression, as this keeps the original data (and doesn't discard any information).

First, I would see if the doctors agree with each other. You can't analyze 50 doctors separately, because you'll overfit the model - one doctor will look great, by chance.

You might try to combine confidence and diagnosis into a 10 point scale. If a doctors says that the patient doesn't have cancer, and they are very confident, that's a 0. If the doc says they do have cancer and they are very confident, that's a 9. If they doc says they don't, and are not confident, that's a 5, etc.

When you're trying to predict, you do some sort of regression analysis, but thinking about the causal ordering of these variables, it's the other way around. Whether the patient has cancer is the cause of the diagnosis, the outcome is the diagnosis.

Your rows should be patients, and your columns should be doctors. You now have a situation that's common in psychometrics (which is why I added the tag).

Then look at the relationships between the scores. Each patient has a mean score, and a score from each doctor. Does the mean score correlate positively with every doctor's score? If not, that doctor is probably not trustworthy (this is called the item-total correlation). Sometimes you remove one doctor from the total score (or mean score) and see if that doctor correlates with the mean of all the other doctors - this is the corrected item total correlation.

You could calculate Cronbach's alpha (which is a form of intra-class correlation), and the alpha without each doctor. Alpha should always rise when you add a doctor, so if it rises when you remove a doctor, that doctor's rating is suspect (this doesn't often tell you anything different from the corrected item-total correlation).

If you use R, this sort of thing is available in the psych package, using the function alpha. If you use Stata, the command is alpha, in SAS it's proc corr, and in SPSS it's under scale, reliability.

Then you can calculate a score, as the mean score from each doctor, or the weighted mean (weighted by the correlation) and see if that score is predictive of the true diagnosis.

Or you could skip that stage, and regress each doctor's score on diagnosis separately, and treat the regression parameters as weights.

Feel free to ask for clarification, and if you want a book, I like Streiner and Norman's "Health Measurement Scales".

-Edit: based on OPs additional info.

Wow, that's a heck of a Cronbach's alpha. The only time I've seen it that high is when a mistake was made.

I would now do logistic regression and look at the ROC curves.

The difference between weighting by regression and correlation depends on how you believe the doctors are responding. Some docs might be generally more confident (without being more skillful), and hence they might use the extreme ranges more. If you want to correct for that, using correlation, rather than regression, does that. I would probably weight by regression, as this keeps the original data (and doesn't discard any information).

Added clarification.
Source Link
Jeremy Miles
  • 19k
  • 6
  • 46
  • 82

You need to knowFirst, I would see if the doctors agree with each other. You can't analyze 50 doctors separately, because you'll overfit the model - one doctor will look great, by chance.

You might try to combine confidence and diagnosis into a 10 point scale. If a doctors says that the patient doesn't have cancer, and they are very confident, that's a 0. If the doc says they do have cancer and they are very confident, that's a 9. If they doc says they don't, and are not confident, that's a 5, etc.

When you're trying to predict, you do some sort of regression analysis, but thinking about the causal ordering of these variables, it's the other way around. Whether the patient has cancer is the cause of the diagnosis - but you don't have a gold standard (do you?), i.e. you don't know if the patient has cancer, so you don't knowoutcome is the true scorediagnosis.

Your rows should be patients, and your columns should be doctors. You now have a situation that's common in psychometrics (which is why I added the tag). You are trying to assess a construct that you believe to exist, but which is measured imperfectly. The first such construct was intelligence (or IQ, but let's not go there), but there are many - attitudes, beliefs, personality, etc.

Then look at the relationships between the scores. Each patient has a mean score, and a score from each doctor. Does the mean score correlate positively with every doctor's score? If not, that doctor is probably not trustworthy (this is called the item-total correlation). Sometimes you remove one doctor from the total score (or mean score) and see if that doctor correlates with the mean of all the other doctors - this is the corrected item total correlation.

You could calculate Cronbach's alpha (which is a form of intra-class correlation), and the alpha without each doctor. Alpha should always rise when you add a doctor, so if it rises when you remove a doctor, that doctor's rating is suspect (this doesn't often tell you anything different from the corrected item-total correlation).

If you use R, this sort of thing is available in the psych package, using the function alpha. If you use Stata, the command is alpha, in SAS it's proc corr, and in SPSS it's under scale, reliability.

IfThen you hadcan calculate a larger sample, you could do things like factor analysis (you could try it anywayscore, butas the results might not be very trustworthy)mean score from each doctor, or because you believe that there are two classesthe weighted mean (people with and without cancerweighted by the correlation) a latent class analysis. I suspect that won't tell you anything interesting withand see if that sample sizescore is predictive of the true diagnosis.

An additional factor you need to consider is the base rate (or prior probability). If the chance of a person having cancer is only 1%, then all doctors agreeing that a person has cancer still probably means that they do not, soOr you should not conclude from your analysiscould skip that 50% of your patients have cancer (in the same waystage, if I tell you that I'm 99.9% sure I saw Elvis working in a grocery storeand regress each doctor's score on diagnosis separately, I probably didn't)and treat the regression parameters as weights.

Feel free to ask for clarification, and if you want a book, I like Streiner and Norman's "Health Measurement Scales".

You need to know if the doctors agree with each other.

You might try to combine confidence and diagnosis into a 10 point scale. If a doctors says that the patient doesn't have cancer, and they are very confident, that's a 0. If the doc says they do have cancer and they are very confident, that's a 9. If they doc says they don't, and are not confident, that's a 5, etc.

When you're trying to predict, you do some sort of regression analysis, but thinking about the causal ordering of these variables, it's the other way around. Whether the patient has cancer is the cause of the diagnosis - but you don't have a gold standard (do you?), i.e. you don't know if the patient has cancer, so you don't know the true score.

Your rows should be patients, and your columns should be doctors. You now have a situation that's common in psychometrics (which is why I added the tag). You are trying to assess a construct that you believe to exist, but which is measured imperfectly. The first such construct was intelligence (or IQ, but let's not go there), but there are many - attitudes, beliefs, personality, etc.

Then look at the relationships between the scores. Each patient has a mean score, and a score from each doctor. Does the mean score correlate positively with every doctor's score? If not, that doctor is probably not trustworthy (this is called the item-total correlation). Sometimes you remove one doctor from the total score (or mean score) and see if that doctor correlates with the mean of all the other doctors - this is the corrected item total correlation.

You could calculate Cronbach's alpha (which is a form of intra-class correlation), and the alpha without each doctor. Alpha should always rise when you add a doctor, so if it rises when you remove a doctor, that doctor's rating is suspect (this doesn't often tell you anything different from the corrected item-total correlation).

If you use R, this sort of thing is available in the psych package, using the function alpha. If you use Stata, the command is alpha, in SAS it's proc corr, and in SPSS it's under scale, reliability.

If you had a larger sample, you could do things like factor analysis (you could try it anyway, but the results might not be very trustworthy), or because you believe that there are two classes (people with and without cancer) a latent class analysis. I suspect that won't tell you anything interesting with that sample size.

An additional factor you need to consider is the base rate (or prior probability). If the chance of a person having cancer is only 1%, then all doctors agreeing that a person has cancer still probably means that they do not, so you should not conclude from your analysis that 50% of your patients have cancer (in the same way, if I tell you that I'm 99.9% sure I saw Elvis working in a grocery store, I probably didn't).

Feel free to ask for clarification, and if you want a book, I like Streiner and Norman's "Health Measurement Scales".

First, I would see if the doctors agree with each other. You can't analyze 50 doctors separately, because you'll overfit the model - one doctor will look great, by chance.

You might try to combine confidence and diagnosis into a 10 point scale. If a doctors says that the patient doesn't have cancer, and they are very confident, that's a 0. If the doc says they do have cancer and they are very confident, that's a 9. If they doc says they don't, and are not confident, that's a 5, etc.

When you're trying to predict, you do some sort of regression analysis, but thinking about the causal ordering of these variables, it's the other way around. Whether the patient has cancer is the cause of the diagnosis, the outcome is the diagnosis.

Your rows should be patients, and your columns should be doctors. You now have a situation that's common in psychometrics (which is why I added the tag).

Then look at the relationships between the scores. Each patient has a mean score, and a score from each doctor. Does the mean score correlate positively with every doctor's score? If not, that doctor is probably not trustworthy (this is called the item-total correlation). Sometimes you remove one doctor from the total score (or mean score) and see if that doctor correlates with the mean of all the other doctors - this is the corrected item total correlation.

You could calculate Cronbach's alpha (which is a form of intra-class correlation), and the alpha without each doctor. Alpha should always rise when you add a doctor, so if it rises when you remove a doctor, that doctor's rating is suspect (this doesn't often tell you anything different from the corrected item-total correlation).

If you use R, this sort of thing is available in the psych package, using the function alpha. If you use Stata, the command is alpha, in SAS it's proc corr, and in SPSS it's under scale, reliability.

Then you can calculate a score, as the mean score from each doctor, or the weighted mean (weighted by the correlation) and see if that score is predictive of the true diagnosis.

Or you could skip that stage, and regress each doctor's score on diagnosis separately, and treat the regression parameters as weights.

Feel free to ask for clarification, and if you want a book, I like Streiner and Norman's "Health Measurement Scales".

Source Link
Jeremy Miles
  • 19k
  • 6
  • 46
  • 82
Loading