deleted 16 characters in body
Source Link
kjetil b halvorsen
  • 82.8k
  • 32
  • 201
  • 663

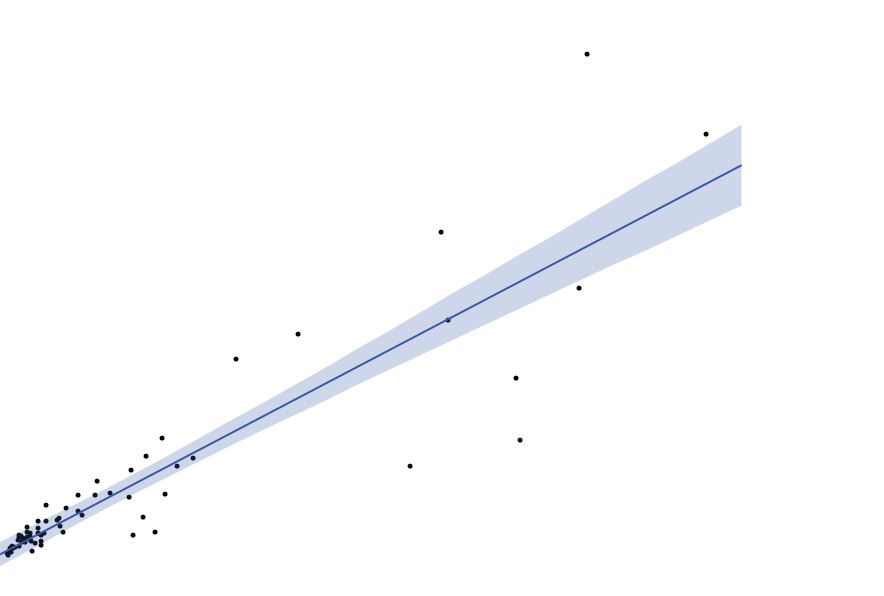
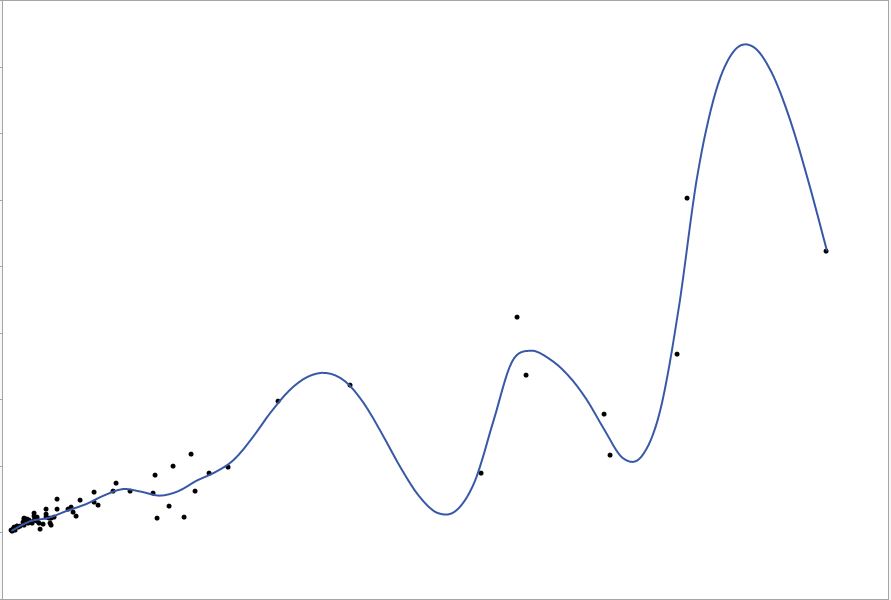
I have data with 2 variables: X - Area Size of a field, Y - Average Production Rate. I need to check the relation between the two. I have plotted the data, and got the following two graphs:

enter image description here

and

enter image description here

Now I have a dilemma. Should I fit a linear regression model, or should I take into account all the little fluctuations in the trend, as shows in the smoothed curve. Which model is better, linear regression or spline fit (which I am not too familiar with). Won't Won't I get overfitting by using the spline model here?

Thank you !

I have data with 2 variables: X - Area Size of a field, Y - Average Production Rate. I need to check the relation between the two. I have plotted the data, and got the following two graphs:

enter image description here

and

enter image description here

Now I have a dilemma. Should I fit a linear regression model, or should I take into account all the little fluctuations in the trend, as shows in the smoothed curve. Which model is better, linear regression or spline fit (which I am not too familiar with). Won't I get overfitting by using the spline model here?

Thank you !
I have data with 2 variables: X - Area Size of a field, Y - Average Production Rate. I need to check the relation between the two. I have plotted the data, and got the following two graphs:

enter image description here

and

enter image description here

Now I have a dilemma. Should I fit a linear regression model, or should I take into account all the little fluctuations in the trend, as shows in the smoothed curve. Which model is better, linear regression or spline fit (which I am not too familiar with). Won't I get overfitting by using the spline model here?

Source Link
BlueSigma
  • 486
  • 1
  • 4
  • 13

Linear Regression or Spline Fit?

I have data with 2 variables: X - Area Size of a field, Y - Average Production Rate. I need to check the relation between the two. I have plotted the data, and got the following two graphs:

enter image description here

and

enter image description here

Now I have a dilemma. Should I fit a linear regression model, or should I take into account all the little fluctuations in the trend, as shows in the smoothed curve. Which model is better, linear regression or spline fit (which I am not too familiar with). Won't I get overfitting by using the spline model here?

Thank you !