added 136 characters in body
Source Link
Pyxel
  • 127
  • 2
  • 13

I'm currently working with R on some oculometric data produced after an experiment I made. I have two conditions ("Risky" & "Safe") and 3 mental states ("Focus" & "Around" & "Mind wandering"). I put subjects doing both condition. Each 2 minutes on average they had to report there mental state ("Focus" & "Around" & "Mind wandering"). To suppress the interindividual variability, I wanted to normalize my data, i.e. take all data for each subject, subtract the mean pupil diameter of this subject and divide by the standard deviation of the same subject.

That done, I'm facing something quite strange. Here is my data before scaling: enter image description here
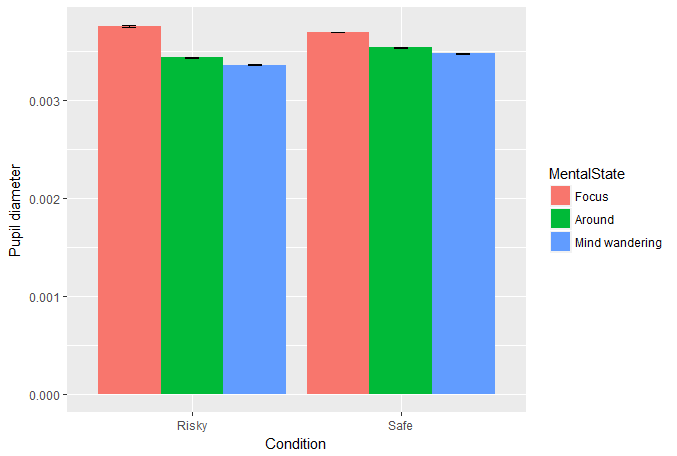
And here is my data after normalization: enter image description here
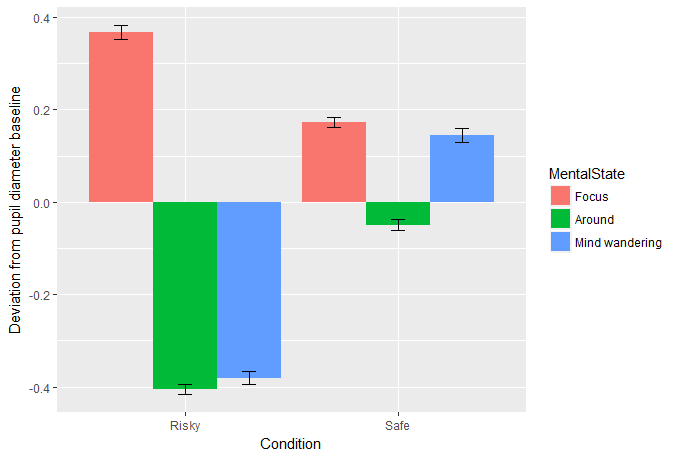
As you can see, the order of mental states on both conditions is different. I'm talking about the fact that I have a kind of linear relation between mental states before, while it gets messy after normalization.

  1. I used the native "scale" for the scaling, I did my own scaling function, both yield the same result.
  2. Subject exhibited different repartition of reports: some were more mind wandering, others more focused.
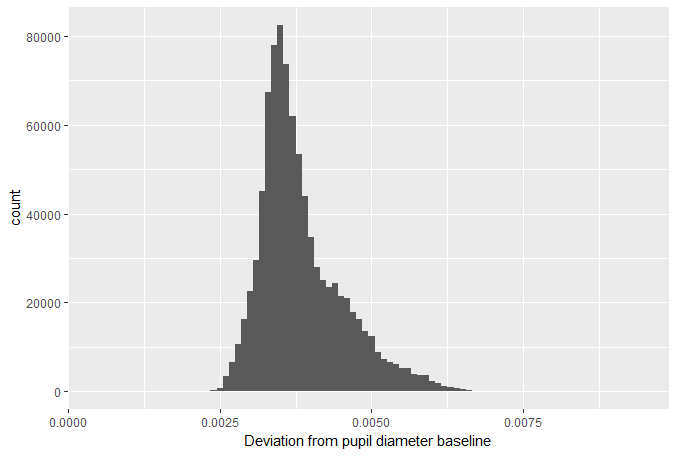
  3. My normalized data are normal (by definition...), however data before are quite skewed to the right.

enter image description here

So my questions are:

  1. is it mathematically possible to have such change?
  2. if yes, what would be the factors allowing such change

I'm currently working with R on some oculometric data produced after an experiment I made. I have two conditions ("Risky" & "Safe") and 3 mental states ("Focus" & "Around" & "Mind wandering"). I put subjects doing both condition. Each 2 minutes on average they had to report there mental state ("Focus" & "Around" & "Mind wandering"). To suppress the interindividual variability, I wanted to normalize my data, i.e. take all data for each subject, subtract the mean pupil diameter of this subject and divide by the standard deviation of the same subject.

That done, I'm facing something quite strange. Here is my data before scaling: enter image description here

And here is my data after normalization: enter image description here

As you can see, the order of mental states on both conditions is different.

  1. I used the native "scale" for the scaling, I did my own scaling function, both yield the same result.
  2. Subject exhibited different repartition of reports: some were more mind wandering, others more focused.
  3. My normalized data are normal (by definition...), however data before are quite skewed to the right.

enter image description here

So my questions are:

  1. is it mathematically possible to have such change?
  2. if yes, what would be the factors allowing such change
I'm currently working with R on some oculometric data produced after an experiment I made. I have two conditions ("Risky" & "Safe") and 3 mental states ("Focus" & "Around" & "Mind wandering"). I put subjects doing both condition. Each 2 minutes on average they had to report there mental state ("Focus" & "Around" & "Mind wandering"). To suppress the interindividual variability, I wanted to normalize my data, i.e. take all data for each subject, subtract the mean pupil diameter of this subject and divide by the standard deviation of the same subject.

That done, I'm facing something quite strange. Here is my data before scaling: enter image description here

And here is my data after normalization: enter image description here

As you can see, the order of mental states on both conditions is different. I'm talking about the fact that I have a kind of linear relation between mental states before, while it gets messy after normalization.

  1. I used the native "scale" for the scaling, I did my own scaling function, both yield the same result.
  2. Subject exhibited different repartition of reports: some were more mind wandering, others more focused.
  3. My normalized data are normal (by definition...), however data before are quite skewed to the right.

enter image description here

So my questions are:

  1. is it mathematically possible to have such change?
  2. if yes, what would be the factors allowing such change
Source Link
Pyxel
  • 127
  • 2
  • 13

Can normalization modify the results of an analysis?

I'm currently working with R on some oculometric data produced after an experiment I made. I have two conditions ("Risky" & "Safe") and 3 mental states ("Focus" & "Around" & "Mind wandering"). I put subjects doing both condition. Each 2 minutes on average they had to report there mental state ("Focus" & "Around" & "Mind wandering"). To suppress the interindividual variability, I wanted to normalize my data, i.e. take all data for each subject, subtract the mean pupil diameter of this subject and divide by the standard deviation of the same subject.

That done, I'm facing something quite strange. Here is my data before scaling: enter image description here

And here is my data after normalization: enter image description here

As you can see, the order of mental states on both conditions is different.

  1. I used the native "scale" for the scaling, I did my own scaling function, both yield the same result.
  2. Subject exhibited different repartition of reports: some were more mind wandering, others more focused.
  3. My normalized data are normal (by definition...), however data before are quite skewed to the right.

enter image description here

So my questions are:

  1. is it mathematically possible to have such change?
  2. if yes, what would be the factors allowing such change