added 1614 characters in body
Source Link
DeltaIV
  • 18.4k
  • 7
  • 78
  • 122
# build model
model <- gam(Voltage ~ s(Amplification, sp = 0.001), data = device)

# compute predictions with standard errors and rename columns to make plotting simpler 
Amplifications <- data.frame(Amplification = seq(min(APD_data$Amplification), 
                                           max(APD_data$Amplification), length.out = 500))
predictions <- predict.gam(model, Amplifications, se.fit = TRUE)
predictions <- cbind(Amplifications, predictions)
predictions <- rename(predictions, Voltage = fit) 

# plot data, model and standard errors
ggplot(device, aes(x = Amplification, y = Voltage)) +
+   geom_point() +
+  geom_ribbon(data geom_smooth= predictions, 
              aes(methodymin = "gam"Voltage - 1.96*se.fit, formulaymax = yVoltage ~+ s(x1.96*se.fit), se
              fill = T"grey70", alpha = 0.5) +
  geom_line(data = predictions, color = "blue")

enter image description hereenter image description here

enter image description here

log_model <- gam(Voltage ~ s(log(Amplification)), data = device)
# the rest of the code stays the same, except for log_model in place of model

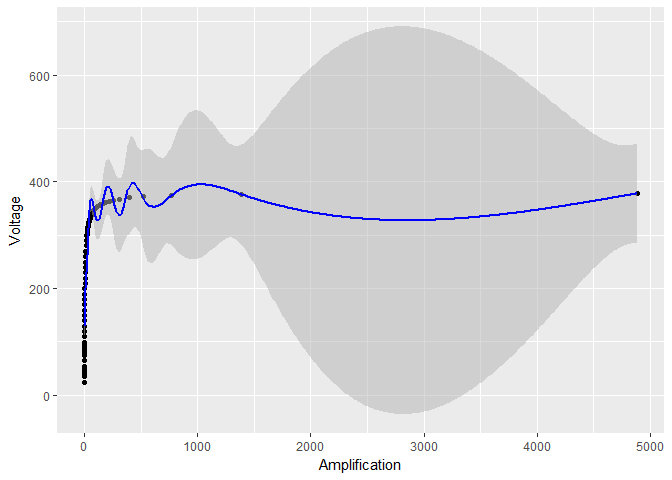
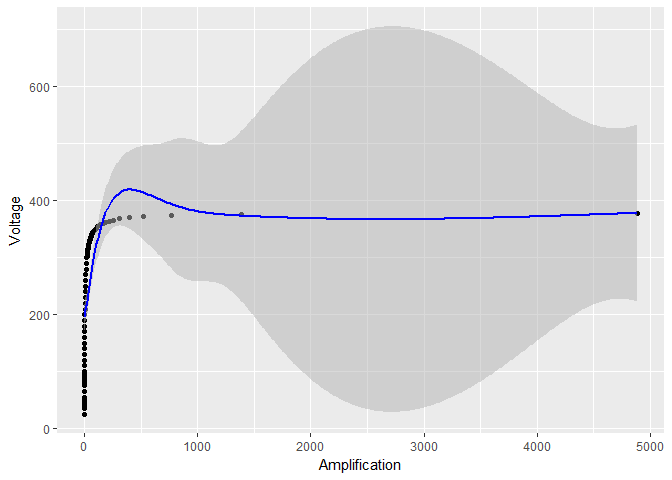
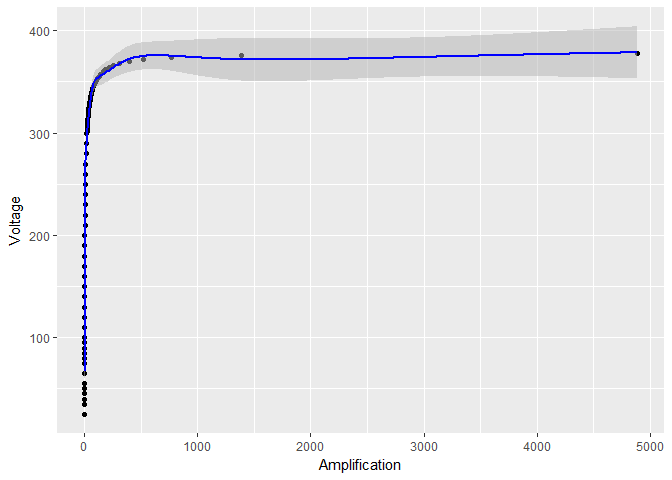
Clearlyenter image description here Clearly something fishy is going on. Are these confidence intervals reliable? EDIT this is not simply a problem of the degree of smoothing, as it was suggested in an answer. Without the log-transform, the smoothing parameter is
> model$sp
s(Amplification) 
     5.03049e-07 

With the log-transform, the smoothing parameter is indeed much bigger:

>log_model$sp
s(log(Amplification)) 
         0.0005156608 

But this is not the reason why the confidence intervals become so small. As a matter of fact, using an even bigger smoothing parameter sp = 0.001, but avoiding any log-transform, oscillations are reduced (as in the log-transform case) but the standard errors are still huge with respect to the log-transform case:

smooth_model <- gam(Voltage ~ s(Amplification, sp = 0.001), data = device)
# the rest of the code stays the same, except for smooth_model in place of model

enter image description here

In general, if I log transform $X$ and/or $Y$, what happens to the confidence intervals? NOTE: If a general rule, or at least some rule of thumb, cannot be given in the general case, I'm ok with anit's not possible to answer which only explains if/how confidence intervals are affected, when log-transforming in the two specific cases I mention.

EDIT I'm feeling generous today ;-) if explaining the changequantitatively in confidence intervals for the GAMgeneral case is too difficult, I could stillwill accept an answer which only gives ais quantitative answer(i.e., it shows a formula) for the first case, (the exponential model) and gives at least an hand-waving argument for the GAMsecond case (GAM model).

ggplot(device, aes(x = Amplification, y = Voltage)) +
+   geom_point() +
+   geom_smooth(method = "gam", formula = y ~ s(x), se = T)

enter image description here

enter image description here

Clearly something fishy is going on. Are these confidence intervals reliable? In general, if I log transform $X$ and/or $Y$, what happens to the confidence intervals? NOTE: If a general rule, or at least some rule of thumb, cannot be given in the general case, I'm ok with an answer which only explains if/how confidence intervals are affected, when log-transforming in the two specific cases I mention.

EDIT I'm feeling generous today ;-) if explaining the change in confidence intervals for the GAM case is too difficult, I could still accept an answer which only gives a quantitative answer for the first case, and at least an hand-waving argument for the GAM case.

# build model
model <- gam(Voltage ~ s(Amplification, sp = 0.001), data = device)

# compute predictions with standard errors and rename columns to make plotting simpler 
Amplifications <- data.frame(Amplification = seq(min(APD_data$Amplification), 
                                           max(APD_data$Amplification), length.out = 500))
predictions <- predict.gam(model, Amplifications, se.fit = TRUE)
predictions <- cbind(Amplifications, predictions)
predictions <- rename(predictions, Voltage = fit) 

# plot data, model and standard errors
ggplot(device, aes(x = Amplification, y = Voltage)) +
  geom_point() +
  geom_ribbon(data = predictions, 
              aes(ymin = Voltage - 1.96*se.fit, ymax = Voltage + 1.96*se.fit), 
              fill = "grey70", alpha = 0.5) +
  geom_line(data = predictions, color = "blue")

enter image description here

log_model <- gam(Voltage ~ s(log(Amplification)), data = device)
# the rest of the code stays the same, except for log_model in place of model

enter image description here Clearly something fishy is going on. Are these confidence intervals reliable? EDIT this is not simply a problem of the degree of smoothing, as it was suggested in an answer. Without the log-transform, the smoothing parameter is

> model$sp
s(Amplification) 
     5.03049e-07 

With the log-transform, the smoothing parameter is indeed much bigger:

>log_model$sp
s(log(Amplification)) 
         0.0005156608 

But this is not the reason why the confidence intervals become so small. As a matter of fact, using an even bigger smoothing parameter sp = 0.001, but avoiding any log-transform, oscillations are reduced (as in the log-transform case) but the standard errors are still huge with respect to the log-transform case:

smooth_model <- gam(Voltage ~ s(Amplification, sp = 0.001), data = device)
# the rest of the code stays the same, except for smooth_model in place of model

enter image description here

In general, if I log transform $X$ and/or $Y$, what happens to the confidence intervals? If it's not possible to answer quantitatively in the general case, I will accept an answer which is quantitative (i.e., it shows a formula) for the first case (the exponential model) and gives at least an hand-waving argument for the second case (GAM model).

added 272 characters in body
Source Link
DeltaIV
  • 18.4k
  • 7
  • 78
  • 122

EDIT I'm feeling generous today ;-) if explaining the change in confidence intervals for the GAM case is too difficult, I could still accept an answer which only gives a quantitative answer for the first case, and at least an hand-waving argument for the GAM case.

EDIT I'm feeling generous today ;-) if explaining the change in confidence intervals for the GAM case is too difficult, I could still accept an answer which only gives a quantitative answer for the first case, and at least an hand-waving argument for the GAM case.

Tweeted twitter.com/StackStats/status/933508253585113088
edited tags
Link
DeltaIV
  • 18.4k
  • 7
  • 78
  • 122
Source Link
DeltaIV
  • 18.4k
  • 7
  • 78
  • 122
Loading