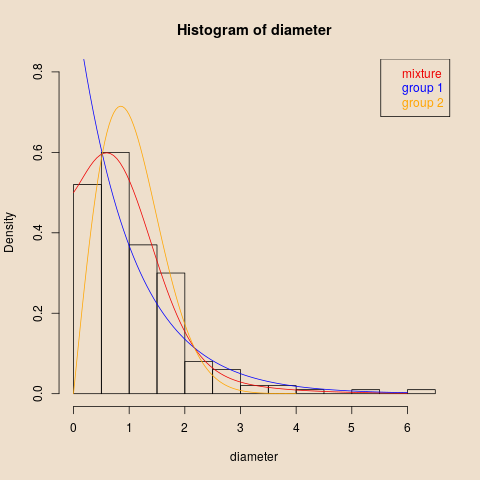
If the null hypothesis is that the distributions in the two groups are equal, the alternative that they are different, you can estimate the weibull parameters under the two distributions, and compute a likelihood ratio test. Look at fit GLM for weibull family and its answers.
In your case, you would create variables diameter containing the measured diameters for both groups, and an indicator variable group (factor) with values G11 and G22. Then you could fitThe R glm function do not have a model likeweibull family, but the gamlss package do have (multiple ones, with different parameterization). Setting up and simulating some data:
mod1set.seed(7*11*13)
diameter <- glmc(diameter ~ grouprweibull(100, family1,1),rweibull(100,2,1.2))
group =<- weibullc(link='log'rep(1,100), datarep(2,100))
simdata =<- data.frame(diameter=diameter, group=groupgroup=as.factor(group))

library(MASS)
summarylibrary(gamlss)
Then fitting the two nested models, and calculating the likelihood ratio test:
mod1 <- gamlss(diameter ~ 1, family=WEI(), data=simdata)
anova...
mod2 <- gamlss(diameter ~ group, diameter ~ group, family=WEI(), data=simdata)
...
LR.test(mod1, mod2)
 Likelihood Ratio Test for nested GAMLSS models.
 (No check whether the models are nested is performed).

       Null model: deviance= 424.7234 with  2 deg. of freedom
 Alternative model: deviance= 373.4748 with  4 deg. of freedom

 LRT = 51.24854 with 2 deg. of freedom and p-value= 7.439049e-12
and you could answer from that outputso the null hypothesis of equal distribution in the two groups is clearly rejected.

