As said in comments, one way would be to fit a regression model, and then plot predictions with some covariates hold at fixed values, and the one used on the x-axis with its observed values. The Rpackage effects (on CRAN) can be useful.
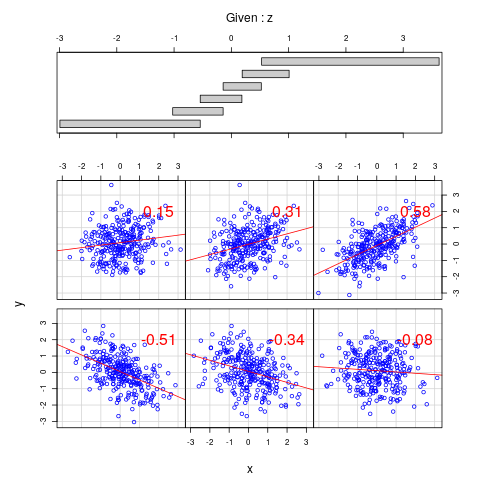
Another idea, especially with three variables (but combined with the above ideas could be used with more) is conditioning plots, made in R with the function coplot. On this site some examples can be found here, used for investigating interactions, another example with R dataset swiss, and used for investigating conditional correlations, or search this site.
Finally, one example, showing conditional correlations, from the post Can I analyze or model a conditional correlation?

