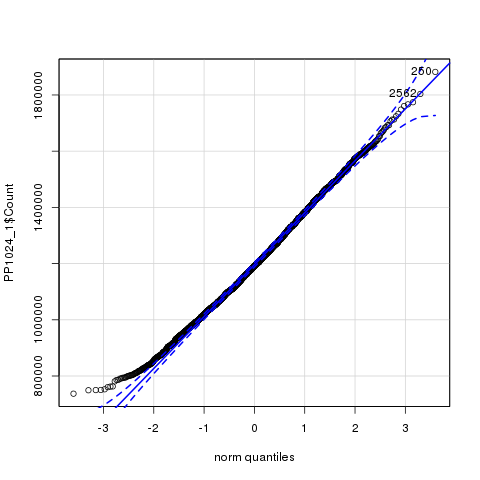
I have a data set which gives a p value of $9.661\times10^{-7}$ under the Shapiro-Wilk test - in other words not very normal.
But the common advice is use visual inspection and the qq Plot for this data set is as below and it looks sufficiently normal - especially at the top end (which is what I am interested in).
My question is: how safe is it to look at this sort of visual display and say that, because the top end looks normal I am ok to base calculations about the behaviour of the right side of the distribution on that assumption?

