added 453 characters in body
Source Link

I need some advice on performing statistical tests on financial ratios and highly skewed data. I have gathered a large sample of several financial ratios for two groups. The sample size is + 40,000 (10yr period) for each ratio. As is known in literature, the distribution of most financial ratios is highly skewed and doesn’t follow a normal distribution. To a large degree this is caused by outliers (and partly due to non-negative values). Take i.e. the market to book ratio. If the denominator approaches to zero the ratio get extremely large. In my case the max value is +8.000 (S&P Industry average is 2.54 for the same period). Though mathematically correct, there is no economic meaning. Skewness for the distribution is 86, the median 2.06 and the mean 4.53. For some other ratios, skewness statistics reach values up to 300.

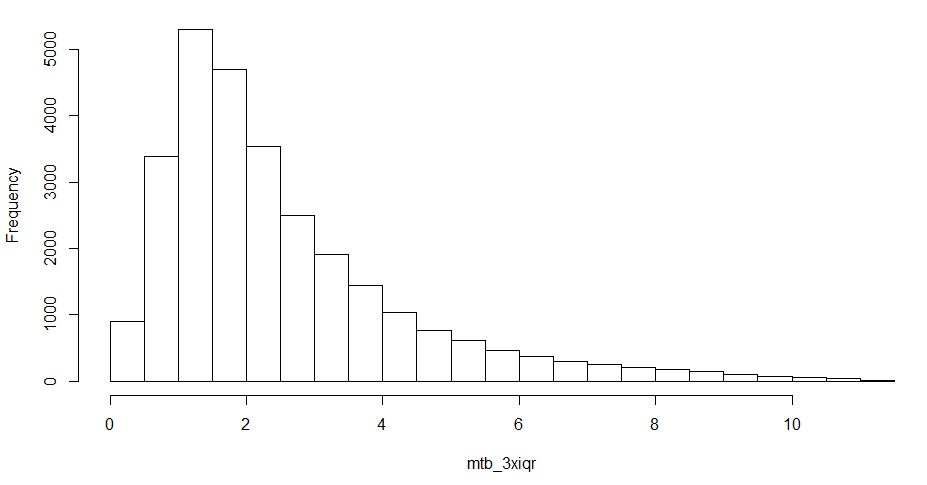
After conducting tukey’s fence (interquartile range rule) for outlier treatment, where I eliminate all values larger than the outer fence (q1 - 3.0xIQR & q3 + 3.0IQR), skewness is 1.63, the median 1.98 and the mean 2.51. I know there is a large debate on how to deal (or not deal) with outliers, but in my case I have to reduce their influence.

So, my questions are as follows:

  1. Is the outlier treatment reasonable?
  2. Can I conduct a Welch's t-test? Variances are not equal. After treating for outliers, most skewness statistics are close to -1.5 and +1.5 max is 3.5. I found that literature is mixed on that topic.
  3. Why are so many studies out there conducting t-tests on financial ratios, without reporting skewness statistics or outlier treatment, though non-normality can be assumed?
  4. Are there better ways to deal with the data?

Any help is highly appreciated. Thanks in advance!

Update: I just added two histograms. The first one uses 3*iqr rule and the second is wisorizing at the 5%,95%-percentile level. Skewness after winsorizing is 1.57, mean 2.81 and median is 2.06. So, is winsorizing in that situation the better (more scientific) option?

enter image description here

enter image description here

I need some advice on performing statistical tests on financial ratios and highly skewed data. I have gathered a large sample of several financial ratios for two groups. The sample size is + 40,000 (10yr period) for each ratio. As is known in literature, the distribution of most financial ratios is highly skewed and doesn’t follow a normal distribution. To a large degree this is caused by outliers (and partly due to non-negative values). Take i.e. the market to book ratio. If the denominator approaches to zero the ratio get extremely large. In my case the max value is +8.000 (S&P Industry average is 2.54 for the same period). Though mathematically correct, there is no economic meaning. Skewness for the distribution is 86, the median 2.06 and the mean 4.53. For some other ratios, skewness statistics reach values up to 300.

After conducting tukey’s fence (interquartile range rule) for outlier treatment, where I eliminate all values larger than the outer fence (q1 - 3.0xIQR & q3 + 3.0IQR), skewness is 1.63, the median 1.98 and the mean 2.51. I know there is a large debate on how to deal (or not deal) with outliers, but in my case I have to reduce their influence.

So, my questions are as follows:

  1. Is the outlier treatment reasonable?
  2. Can I conduct a Welch's t-test? Variances are not equal. After treating for outliers, most skewness statistics are close to -1.5 and +1.5 max is 3.5. I found that literature is mixed on that topic.
  3. Why are so many studies out there conducting t-tests on financial ratios, without reporting skewness statistics or outlier treatment, though non-normality can be assumed?
  4. Are there better ways to deal with the data?

Any help is highly appreciated. Thanks in advance!

Update: I just added two histograms. The first one uses 3*iqr rule and the second is wisorizing at the 5%,95%-percentile level. Skewness after winsorizing is 1.57, mean 2.81 and median is 2.06. So, is winsorizing in that situation the better (more scientific) option?

enter image description here

enter image description here

Source Link

Performing t-test on highly skewed financial data + outlier treatment?

I need some advice on performing statistical tests on financial ratios and highly skewed data. I have gathered a large sample of several financial ratios for two groups. The sample size is + 40,000 (10yr period) for each ratio. As is known in literature, the distribution of most financial ratios is highly skewed and doesn’t follow a normal distribution. To a large degree this is caused by outliers (and partly due to non-negative values). Take i.e. the market to book ratio. If the denominator approaches to zero the ratio get extremely large. In my case the max value is +8.000 (S&P Industry average is 2.54 for the same period). Though mathematically correct, there is no economic meaning. Skewness for the distribution is 86, the median 2.06 and the mean 4.53. For some other ratios, skewness statistics reach values up to 300.

After conducting tukey’s fence (interquartile range rule) for outlier treatment, where I eliminate all values larger than the outer fence (q1 - 3.0xIQR & q3 + 3.0IQR), skewness is 1.63, the median 1.98 and the mean 2.51. I know there is a large debate on how to deal (or not deal) with outliers, but in my case I have to reduce their influence.

So, my questions are as follows:

  1. Is the outlier treatment reasonable?
  2. Can I conduct a Welch's t-test? Variances are not equal. After treating for outliers, most skewness statistics are close to -1.5 and +1.5 max is 3.5. I found that literature is mixed on that topic.
  3. Why are so many studies out there conducting t-tests on financial ratios, without reporting skewness statistics or outlier treatment, though non-normality can be assumed?
  4. Are there better ways to deal with the data?

Any help is highly appreciated. Thanks in advance!