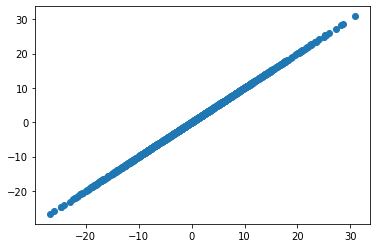
Given two random variables, you can calculate their covariance matrix. I noticed that if I plot data (in my case multi-variate normal) coming from a cov-matrix who'swhose elements are all the same, e.g.
$\begin{pmatrix} 100 & 100 \\ 100 & 100 \end{pmatrix}$
You will get a straight line. e.g. in python:
data = np.random.multivariate_normal([0,0], [[100,100],[100,100]], 1000)
plt.scatter(data[:,0], data[:,1])
I wonder if this implies that $x=y$ ?
Also, can there be a case where $cov(x,y) = cov(x,x) \ne cov(y,y)$ and if so, is there any insight about what's going on there?

