added 5 characters in body
Source Link
BruceET
  • 57.6k
  • 2
  • 36
  • 94

Your goals are not sufficiently clear to be to give a complete answer. First, maybe you mean that data in A-D are 'blocked' (not 'paired'). That might mean that there are $n$ subjects, each producing scores A-D.

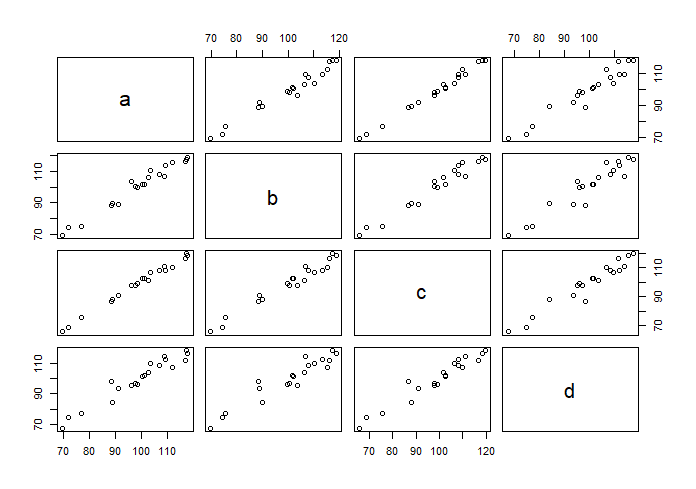
Then you might want to begin by looking at scores A-D to see how they may be correlated. You can easily look at the correlation between A & B, between A & C, and so on, as illustrated in R below:

set.seed(2020)
a = rnorm(20, 100, 10)
b = a + rnorm(20,0,3)
c = a + rnorm(20,0,3)
d = a + rnorm(20,0,3)
MAT = cbind(a,b,c,d)
round(cor(MAT),3)
      a     b     c     d
a 1.000 0.984 0.996 0.965
b 0.984 1.000 0.982 0.950
c 0.996 0.982 1.000 0.968
d 0.965 0.950 0.968 1.000

pairs(MAT)

enter image description here

Similarly, for W-Z.

It is not clear what kinds of comparisons you might want to make between A through D and W through Z. You might look at differences A-W, B-X, and so on. Or you might get compare a summary score of E of A,B,C,D and with a summary score V of W,X,Y,Z.

Such paired comparisons could be made with a paired t test or paired Wilcoxon (signed-rank) test, depending on the nature of the data.

Also, there are multi-level ANOVA designs that could take a more detailed look at A through D compared with W through Z.

Please revise your question, if you would like more detailed guidance toward your main objectives, so some of us can see what you have in mind.

Your goals are not sufficiently clear to be to give a complete answer. First, maybe you mean that data in A-D are 'blocked' (not 'paired'). That might mean that there are $n$ subjects, each producing scores A-D.

Then you might want to begin by looking at scores A-D to see how they may be correlated. You can easily look at the correlation between A & B, between A & C, and so on, as illustrated in R below:

set.seed(2020)
a = rnorm(20, 100, 10)
b = a + rnorm(20,0,3)
c = a + rnorm(20,0,3)
d = a + rnorm(20,0,3)
MAT = cbind(a,b,c,d)
round(cor(MAT),3)
      a     b     c     d
a 1.000 0.984 0.996 0.965
b 0.984 1.000 0.982 0.950
c 0.996 0.982 1.000 0.968
d 0.965 0.950 0.968 1.000

pairs(MAT)

enter image description here

Similarly, for W-Z.

It is not clear what kinds of comparisons you might want to make between A through D and W through Z. You might look at differences A-W, B-X, and so on. Or you might get compare a summary score of E of A,B,C,D and with a summary score V of W,X,Y,Z.

Such paired comparisons could be made with a paired t test or paired Wilcoxon (signed-rank) test, depending on the nature of the data.

Also, there are multi-level ANOVA designs that could a more detailed look at A through D compared with W through Z.

Please revise your question, if you would like more detailed guidance toward your main objectives, so some of us can see what you have in mind.

Your goals are not sufficiently clear to be to give a complete answer. First, maybe you mean that data in A-D are 'blocked' (not 'paired'). That might mean that there are $n$ subjects, each producing scores A-D.

Then you might want to begin by looking at scores A-D to see how they may be correlated. You can easily look at the correlation between A & B, between A & C, and so on, as illustrated in R below:

set.seed(2020)
a = rnorm(20, 100, 10)
b = a + rnorm(20,0,3)
c = a + rnorm(20,0,3)
d = a + rnorm(20,0,3)
MAT = cbind(a,b,c,d)
round(cor(MAT),3)
      a     b     c     d
a 1.000 0.984 0.996 0.965
b 0.984 1.000 0.982 0.950
c 0.996 0.982 1.000 0.968
d 0.965 0.950 0.968 1.000

pairs(MAT)

enter image description here

Similarly, for W-Z.

It is not clear what kinds of comparisons you might want to make between A through D and W through Z. You might look at differences A-W, B-X, and so on. Or you might get compare a summary score of E of A,B,C,D and with a summary score V of W,X,Y,Z.

Such paired comparisons could be made with a paired t test or paired Wilcoxon (signed-rank) test, depending on the nature of the data.

Also, there are multi-level ANOVA designs that could take a more detailed look at A through D compared with W through Z.

Please revise your question, if you would like more detailed guidance toward your main objectives, so some of us can see what you have in mind.

Source Link
BruceET
  • 57.6k
  • 2
  • 36
  • 94

Your goals are not sufficiently clear to be to give a complete answer. First, maybe you mean that data in A-D are 'blocked' (not 'paired'). That might mean that there are $n$ subjects, each producing scores A-D.

Then you might want to begin by looking at scores A-D to see how they may be correlated. You can easily look at the correlation between A & B, between A & C, and so on, as illustrated in R below:

set.seed(2020)
a = rnorm(20, 100, 10)
b = a + rnorm(20,0,3)
c = a + rnorm(20,0,3)
d = a + rnorm(20,0,3)
MAT = cbind(a,b,c,d)
round(cor(MAT),3)
      a     b     c     d
a 1.000 0.984 0.996 0.965
b 0.984 1.000 0.982 0.950
c 0.996 0.982 1.000 0.968
d 0.965 0.950 0.968 1.000

pairs(MAT)

enter image description here

Similarly, for W-Z.

It is not clear what kinds of comparisons you might want to make between A through D and W through Z. You might look at differences A-W, B-X, and so on. Or you might get compare a summary score of E of A,B,C,D and with a summary score V of W,X,Y,Z.

Such paired comparisons could be made with a paired t test or paired Wilcoxon (signed-rank) test, depending on the nature of the data.

Also, there are multi-level ANOVA designs that could a more detailed look at A through D compared with W through Z.

Please revise your question, if you would like more detailed guidance toward your main objectives, so some of us can see what you have in mind.