Added more details and histograms.
Source Link

I'm running an A/B test to see if the improved website layout increases revenue. First, I would like to check if the sizes of the control and experiment groups are statistically different.

I have data on the number of users visiting the site per day within 29 days. Below I will insert the data from the first 5 days:

Day Control Visits Experiment Visits
1   1764           1850
2   1541           1590
3   1457           1515
4   1587           1541
5   1606           1643

It seems to me that I should use the t- or z-test to achieve my goal, but so far I have used them to test statistical difference between population means, not their sizes.

P.S. This is the first question I asked on stackexchange. Any suggestions or tips on how I can improve the question will be welcomed.

Edit: I would like to clarify a few things. I'm running an A/B test for a company which sells software through a website. As I mentioned before the aim of the test is to see if the modified site layout leads to an increased number of purchased licenses. The control and experiment groups were created by randomly assigning a cookie file to each unique visitor upon their first site hit.

I would like to test if number of cookies (visit counts) from the control and experiment group are not statistically different to reduce bias of the experiment (and generally make it more valid).

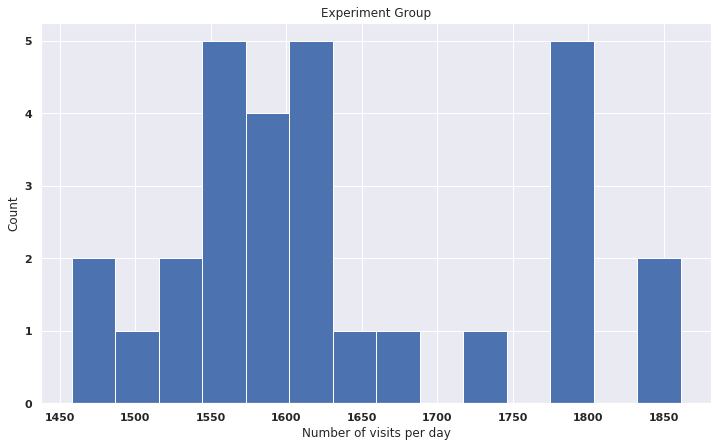
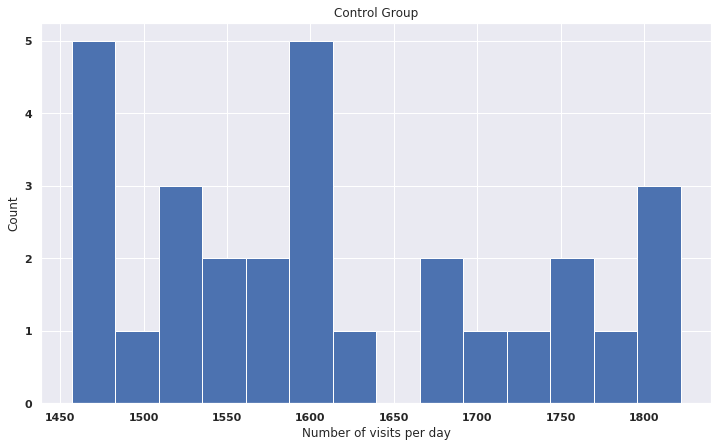
The distributions of the visits for both of the groups are not normal, as shown in the histograms: Control group
enter image description here

I'm running an A/B test to see if the improved website layout increases revenue. First, I would like to check if the sizes of the control and experiment groups are statistically different.

I have data on the number of users visiting the site per day within 29 days. Below I will insert the data from the first 5 days:

Day Control Visits Experiment Visits
1   1764           1850
2   1541           1590
3   1457           1515
4   1587           1541
5   1606           1643

It seems to me that I should use the t- or z-test to achieve my goal, but so far I have used them to test statistical difference between population means, not their sizes.

P.S. This is the first question I asked on stackexchange. Any suggestions or tips on how I can improve the question will be welcomed.

Edit: I would like to clarify a few things. I'm running an A/B test for a company which sells software through a website. As I mentioned before the aim of the test is to see if the modified site layout leads to an increased number of purchased licenses. The control and experiment groups were created by randomly assigning a cookie file to each unique visitor upon their first site hit.

I would like to test if number of cookies (visit counts) from the control and experiment group are not statistically different to reduce bias of the experiment (and generally make it more valid).

The distributions of the visits for both of the groups are not normal, as shown in the histograms: Control group

enter image description here

Source Link

Test if population sizes are statistically different?

I'm running an A/B test to see if the improved website layout increases revenue. First, I would like to check if the sizes of the control and experiment groups are statistically different.

I have data on the number of users visiting the site per day within 29 days. Below I will insert the data from the first 5 days:

Day Control Visits Experiment Visits
1   1764           1850
2   1541           1590
3   1457           1515
4   1587           1541
5   1606           1643

It seems to me that I should use the t- or z-test to achieve my goal, but so far I have used them to test statistical difference between population means, not their sizes.

P.S. This is the first question I asked on stackexchange. Any suggestions or tips on how I can improve the question will be welcomed.