## parameters
set.seed(1)
ns <- 10^5
nbinom <- 40
pbinom <- 0.5

### generate sample
Y <- rbinom(ns, nbinom, pbinom)
X <- rpois(ns, Y)

### plot histogram
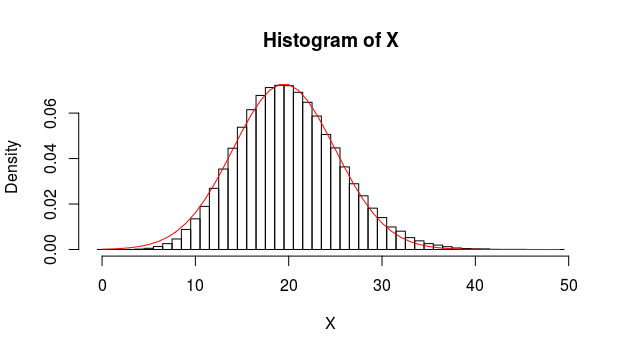
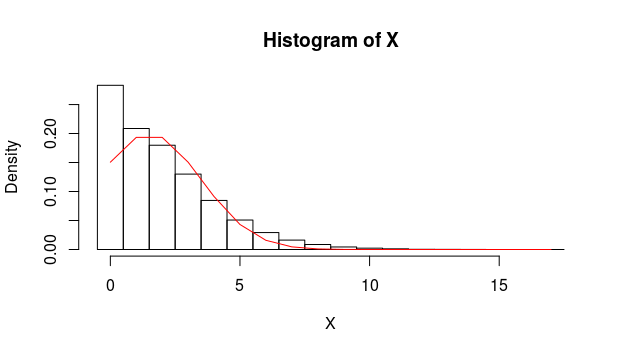
h <- hist(X, breaks = seq(0,max(X)+1)-0.5, freq = 0)

### add curve
xs <- seq(0,max(X))
#lines(xs,dpois(xs,nbinom*pbinom)*ns, col = 2)
lines(xs,dnorm(xs+0.5, mean = nbinom*pbinom,
                     sd = sqrt(nbinom*pbinom*(2-pbinom))), col = 2)

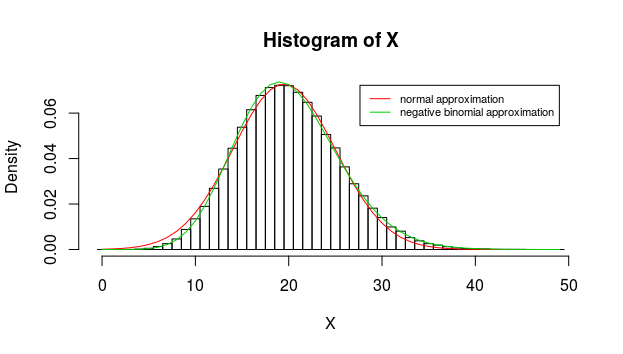
### binomial approximation
mu = nbinom*pbinom
vr = (nbinom*pbinom*(2-pbinom))
p = 1-mu/vr
r = mu*(1-p)/p
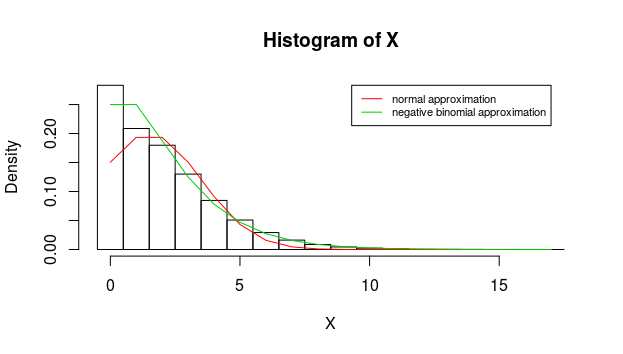
lines(xs,dnbinom(xs, size = r, p= 1-p ), col = 3)

legend(max(X),max(h$density), c("normal approximation", "negative binomial approximation"),
       cex= 0.7, col = c(2,3),lty = 1, xjust = 1)


