added 4 characters in body
Source Link
Richard Hardy
  • 69.5k
  • 13
  • 126
  • 278
library(tidyverse)
library(tidybayes)
library(cmdstanr)

model_code = '
data{
  int N;
  vector[N] x;
  vector[N] y;
}
parameters{
  real alpha;
  real beta;
  real<lower=0> sigma;
}
model{
  alpha ~ normal(0,1);
  beta ~ normal(0,1);
  sigma ~ cauchy(0,1);
  y ~ normal(alpha + beta*x, sigma);
}
generated quantities{
  real yppc[N] = normal_rng(alpha + beta*x, sigma);
}
'
fl = write_stan_file(model_code)
model = cmdstan_model(fl)

N = 10
x = rnorm(N)
y = 2*x + 1 + rnorm(N, 0, 0.45)
model_data = list(N=N, x=x, y=y)
fit = model$sample(model_data, parallel_chains=4)
beta = as.numeric(fit$draws('beta'))
alpha = as.numeric(fit$draws('alpha'))
sigma = as.numeric(fit$draws('sigma'))
beta = as.numeric(fit$draws('beta'))
alpha = as.numeric(fit$draws('alpha'))
sigma = as.numeric(fit$draws('sigma'))
prediction = alpha + beta*3
hist(prediction)
prediction = alpha + beta*3
hist(prediction)
mean(prediction)
>>>7.281336
mean(prediction)
>>>7.281336
library(tidyverse)
library(tidybayes)
library(cmdstanr)

model_code = '
data{
  int N;
  vector[N] x;
  vector[N] y;
}
parameters{
  real alpha;
  real beta;
  real<lower=0> sigma;
}
model{
  alpha ~ normal(0,1);
  beta ~ normal(0,1);
  sigma ~ cauchy(0,1);
  y ~ normal(alpha + beta*x, sigma);
}
generated quantities{
  real yppc[N] = normal_rng(alpha + beta*x, sigma);
}
'
fl = write_stan_file(model_code)
model = cmdstan_model(fl)

N = 10
x = rnorm(N)
y = 2*x + 1 + rnorm(N, 0, 0.45)
model_data = list(N=N, x=x, y=y)
fit = model$sample(model_data, parallel_chains=4)
beta = as.numeric(fit$draws('beta'))
alpha = as.numeric(fit$draws('alpha'))
sigma = as.numeric(fit$draws('sigma'))
prediction = alpha + beta*3
hist(prediction)
mean(prediction)
>>>7.281336
added 58 characters in body
Source Link
Demetri Pananos
  • 39.6k
  • 2
  • 64
  • 151

Correct.

You have draws from posterior, so for a new $x_i$ the corresponding prediction for $\mu$ is $\alpha + \beta x%$$\dfrac{1}{N} \sum _i \alpha_i + \beta_i x%$. If you're familliar with rstanarm, this is what posterior_linpred does. The result is a posterior estimate ofSince the linear predictor for your modelis linear, this should be equal to $E(\alpha) + E(\beta)x$, where $E$ is the expectation. HereHere is an example using Stan.

Let's first set up the model and fit it.

library(tidyverse)
library(tidybayes)
library(cmdstanr)

model_code = '
data{
  int N;
  vector[N] x;
  vector[N] y;
}
parameters{
  real alpha;
  real beta;
  real<lower=0> sigma;
}
model{
  alpha ~ normal(0,1);
  beta ~ normal(0,1);
  sigma ~ cauchy(0,1);
  y ~ normal(alpha + beta*x, sigma);
}
generated quantities{
  real yppc[N] = normal_rng(alpha + beta*x, sigma);
}
'
fl = write_stan_file(model_code)
model = cmdstan_model(fl)

N = 10
x = rnorm(N)
y = 2*x + 1 + rnorm(N, 0, 0.45)
model_data = list(N=N, x=x, y=y)
fit = model$sample(model_data, parallel_chains=4)

Now, extract the draws

beta = as.numeric(fit$draws('beta'))
alpha = as.numeric(fit$draws('alpha'))
sigma = as.numeric(fit$draws('sigma'))

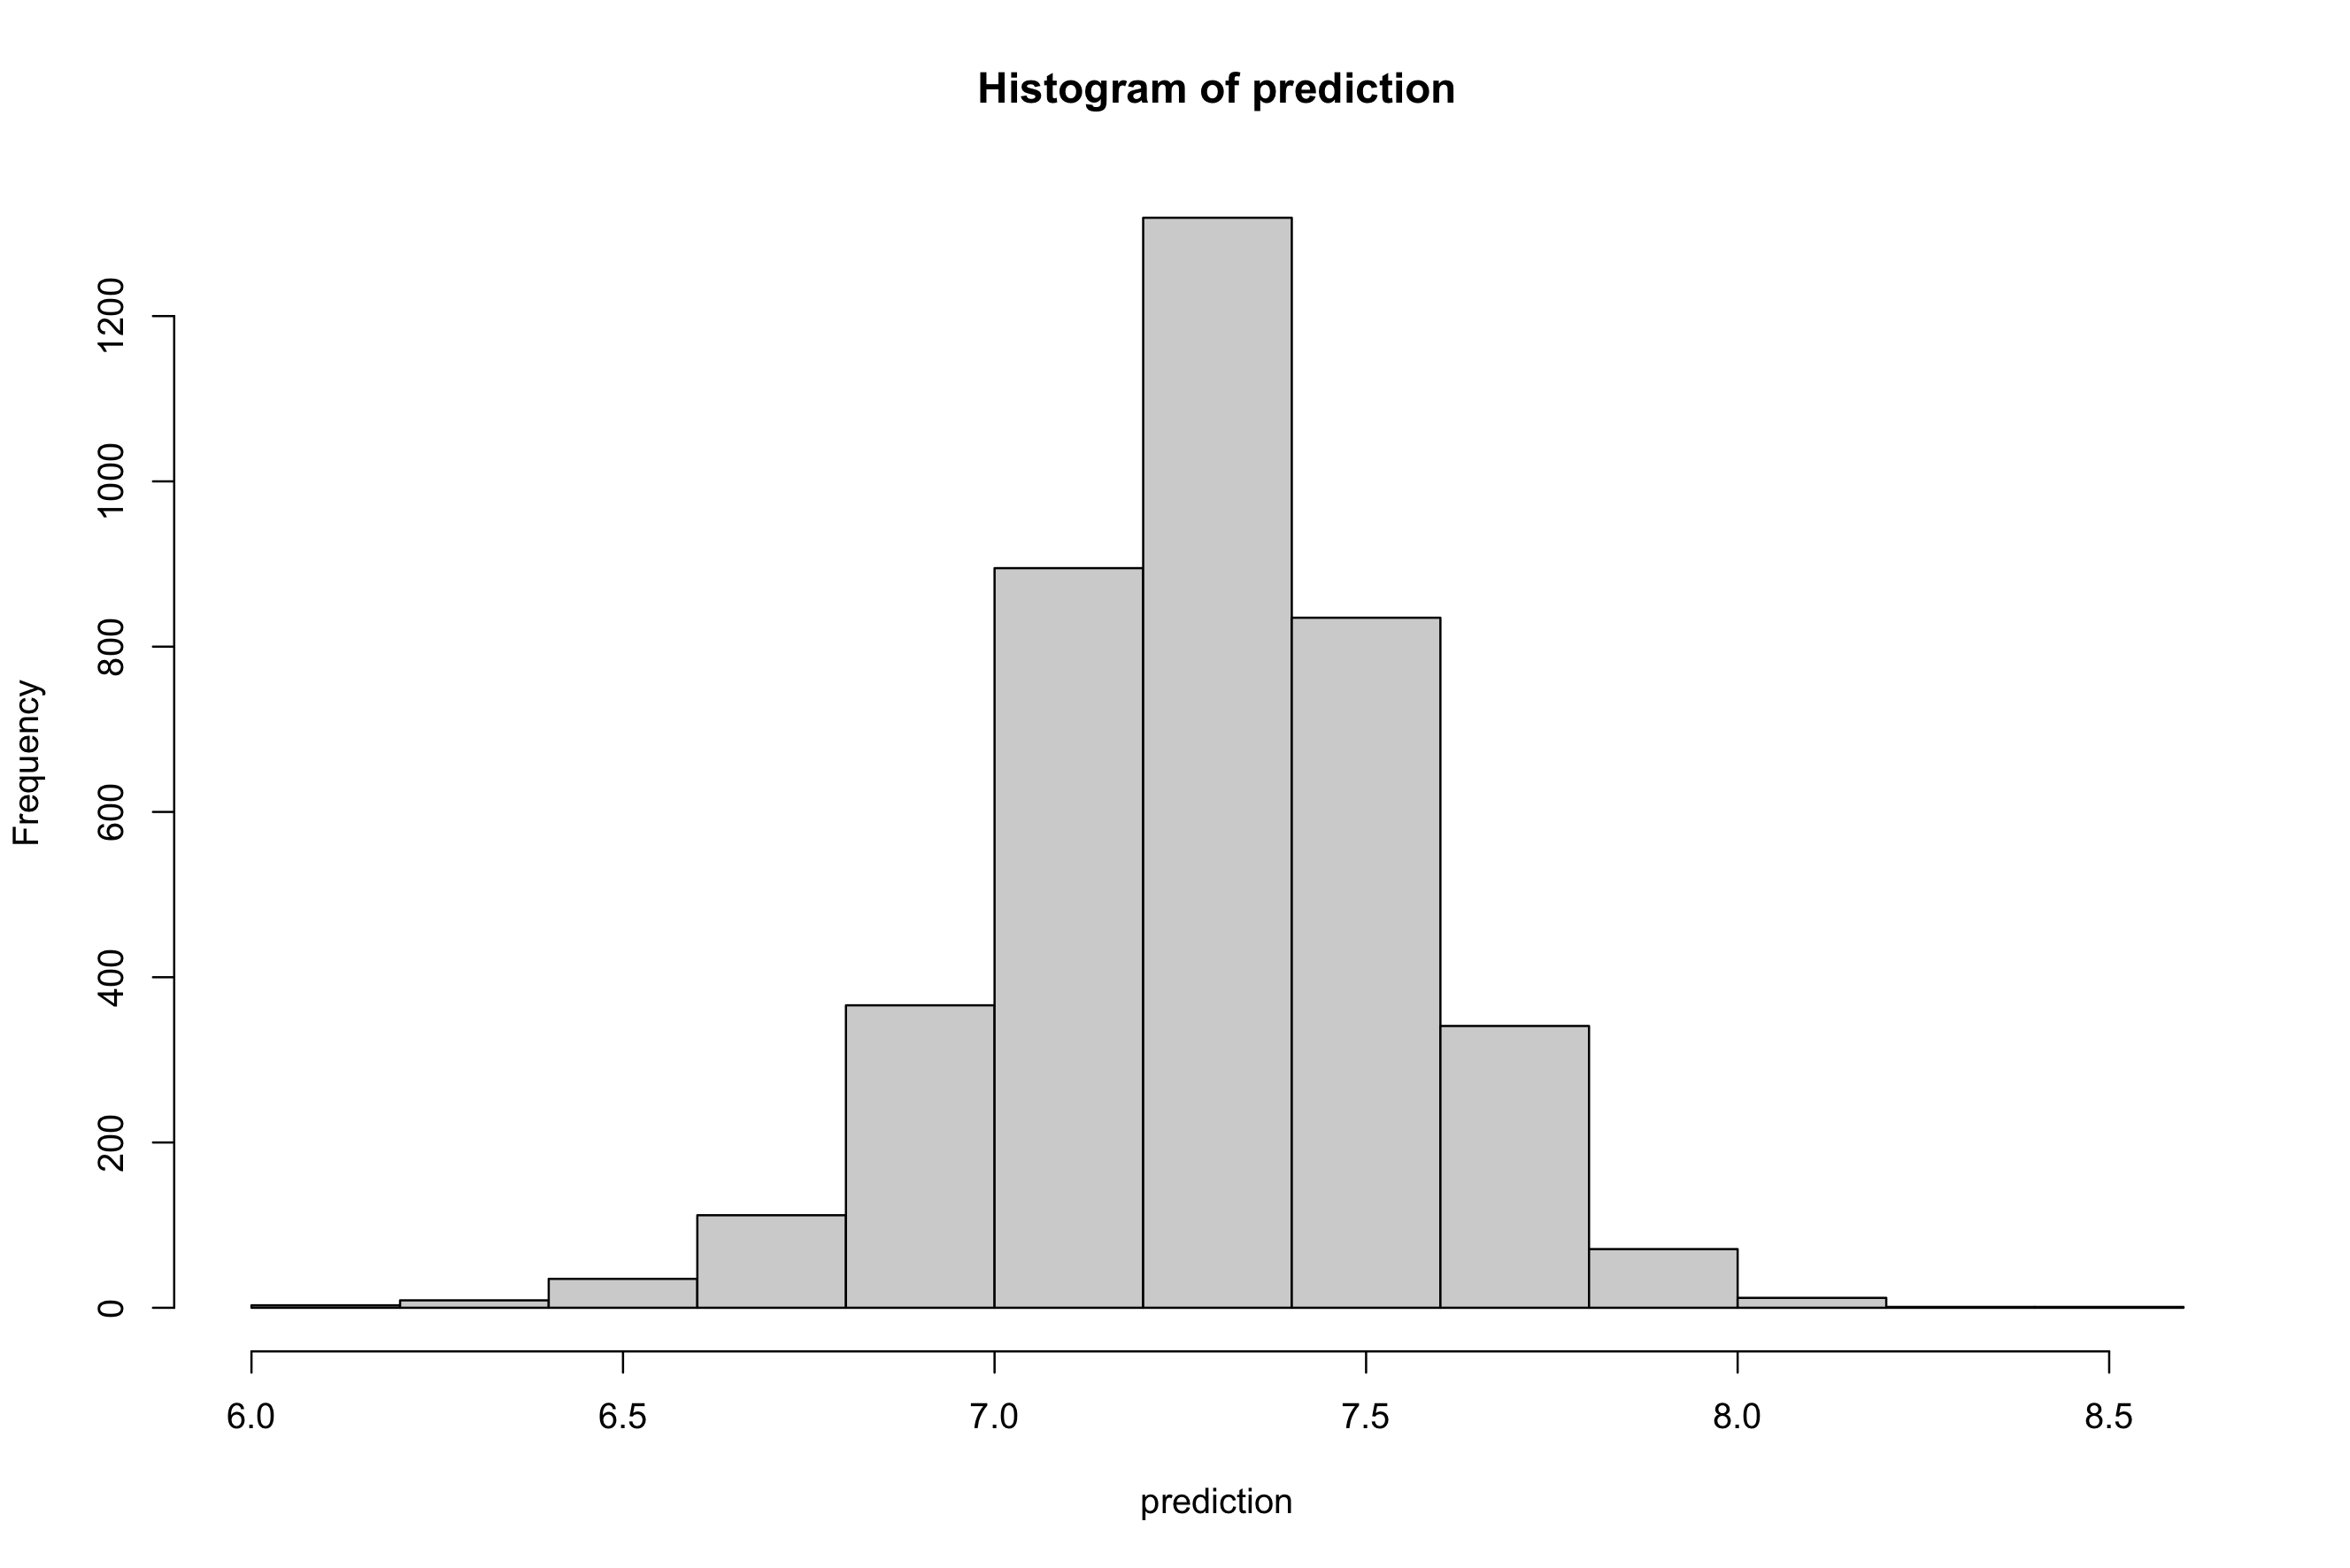
Let's say I want to make a prediction for $x=3$. I should compute $\alpha_i + \beta_i \cdot 3$ for all my posterior $\alpha_i, \beta_i$. In R...

prediction = alpha + beta*3
hist(prediction)

enter image description here

Note that we get a distribution of possible values. Our prediction in this case is the mean of this distribution

mean(prediction)
>>>7.281336

Which is close to the true value of 7.

Correct.

You have draws from posterior, so for a new $x_i$ the corresponding prediction for $\mu$ is $\alpha + \beta x%$. If you're familliar with rstanarm, this is what posterior_linpred does. The result is a posterior estimate of the linear predictor for your model. Here is an example using Stan.

Let's first set up the model and fit it.

library(tidyverse)
library(tidybayes)
library(cmdstanr)

model_code = '
data{
  int N;
  vector[N] x;
  vector[N] y;
}
parameters{
  real alpha;
  real beta;
  real<lower=0> sigma;
}
model{
  alpha ~ normal(0,1);
  beta ~ normal(0,1);
  sigma ~ cauchy(0,1);
  y ~ normal(alpha + beta*x, sigma);
}
generated quantities{
  real yppc[N] = normal_rng(alpha + beta*x, sigma);
}
'
fl = write_stan_file(model_code)
model = cmdstan_model(fl)

N = 10
x = rnorm(N)
y = 2*x + 1 + rnorm(N, 0, 0.45)
model_data = list(N=N, x=x, y=y)
fit = model$sample(model_data, parallel_chains=4)

Now, extract the draws

beta = as.numeric(fit$draws('beta'))
alpha = as.numeric(fit$draws('alpha'))
sigma = as.numeric(fit$draws('sigma'))

Let's say I want to make a prediction for $x=3$. I should compute $\alpha_i + \beta_i \cdot 3$ for all my posterior $\alpha_i, \beta_i$. In R...

prediction = alpha + beta*3
hist(prediction)

enter image description here

Note that we get a distribution of possible values. Our prediction in this case is the mean of this distribution

mean(prediction)
>>>7.281336

Which is close to the true value of 7.

Correct.

You have draws from posterior, so for a new $x_i$ the corresponding prediction for $\mu$ is $\dfrac{1}{N} \sum _i \alpha_i + \beta_i x%$. If you're familliar with rstanarm, this is what posterior_linpred does. Since the predictor is linear, this should be equal to $E(\alpha) + E(\beta)x$, where $E$ is the expectation. Here is an example using Stan.

Let's first set up the model and fit it.

library(tidyverse)
library(tidybayes)
library(cmdstanr)

model_code = '
data{
  int N;
  vector[N] x;
  vector[N] y;
}
parameters{
  real alpha;
  real beta;
  real<lower=0> sigma;
}
model{
  alpha ~ normal(0,1);
  beta ~ normal(0,1);
  sigma ~ cauchy(0,1);
  y ~ normal(alpha + beta*x, sigma);
}
generated quantities{
  real yppc[N] = normal_rng(alpha + beta*x, sigma);
}
'
fl = write_stan_file(model_code)
model = cmdstan_model(fl)

N = 10
x = rnorm(N)
y = 2*x + 1 + rnorm(N, 0, 0.45)
model_data = list(N=N, x=x, y=y)
fit = model$sample(model_data, parallel_chains=4)

Now, extract the draws

beta = as.numeric(fit$draws('beta'))
alpha = as.numeric(fit$draws('alpha'))
sigma = as.numeric(fit$draws('sigma'))

Let's say I want to make a prediction for $x=3$. I should compute $\alpha_i + \beta_i \cdot 3$ for all my posterior $\alpha_i, \beta_i$. In R...

prediction = alpha + beta*3
hist(prediction)

enter image description here

Note that we get a distribution of possible values. Our prediction in this case is the mean of this distribution

mean(prediction)
>>>7.281336

Which is close to the true value of 7.

Source Link
Demetri Pananos
  • 39.6k
  • 2
  • 64
  • 151

Correct.

You have draws from posterior, so for a new $x_i$ the corresponding prediction for $\mu$ is $\alpha + \beta x%$. If you're familliar with rstanarm, this is what posterior_linpred does. The result is a posterior estimate of the linear predictor for your model. Here is an example using Stan.

Let's first set up the model and fit it.

library(tidyverse)
library(tidybayes)
library(cmdstanr)

model_code = '
data{
  int N;
  vector[N] x;
  vector[N] y;
}
parameters{
  real alpha;
  real beta;
  real<lower=0> sigma;
}
model{
  alpha ~ normal(0,1);
  beta ~ normal(0,1);
  sigma ~ cauchy(0,1);
  y ~ normal(alpha + beta*x, sigma);
}
generated quantities{
  real yppc[N] = normal_rng(alpha + beta*x, sigma);
}
'
fl = write_stan_file(model_code)
model = cmdstan_model(fl)

N = 10
x = rnorm(N)
y = 2*x + 1 + rnorm(N, 0, 0.45)
model_data = list(N=N, x=x, y=y)
fit = model$sample(model_data, parallel_chains=4)

Now, extract the draws

beta = as.numeric(fit$draws('beta'))
alpha = as.numeric(fit$draws('alpha'))
sigma = as.numeric(fit$draws('sigma'))

Let's say I want to make a prediction for $x=3$. I should compute $\alpha_i + \beta_i \cdot 3$ for all my posterior $\alpha_i, \beta_i$. In R...

prediction = alpha + beta*3
hist(prediction)

enter image description here

Note that we get a distribution of possible values. Our prediction in this case is the mean of this distribution

mean(prediction)
>>>7.281336

Which is close to the true value of 7.