added 10 characters in body
Source Link
BruceET
  • 57.6k
  • 2
  • 36
  • 94

RANDU vs. runif in R (using Mersenne Twister). One preliminary test in vetting a pseudorandom number generator might be to look at the distribution of points in the unit cube.

# RANDU (multiplicative congruential generator)
a = 65539; d = 2^31; s = 11
m = 20000; r = numeric(m); r[1] = s
for (i in 1:(m-1)) {r[i+1] = (a*r[i]) %% d}
u = (r-.5)/(d-1)
u1 = u[1:(m-2)]; u2 = u[2:(m-1)];  u3=u[3:m]
par(mfrow=c(1,2))
 plot(u1,u2, pch=20, xlim=c(0,.1), ylim=c(0,.1))
 plot(u1[u3<.01], u2[u3<.01], pch=20, xlim=0:1, ylim=0:1)
par(mfrow=c(1,1))

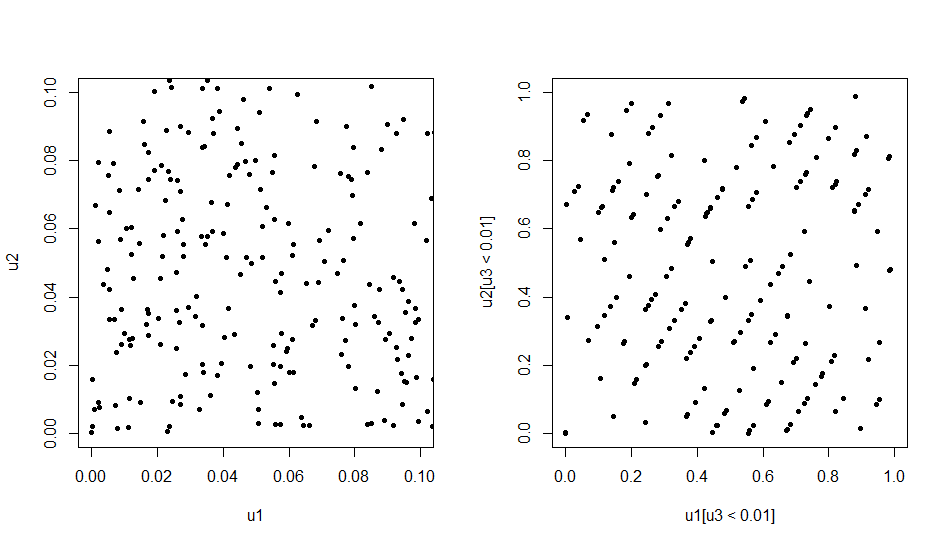
In the figure below, the left panel shows "random" points in the square with vertices $(0,0), (0.1,0.1),$ which look OK. By contrast, points near one face of the unit cube indicate that points in the cube lie on only a few planes.

enter image description here

# 'runif' in R using Mersenne Twister 
set.seed(2021); m = 20000; u = runif(m)
u1 = u[1:(m-2)]; u2 = u[2:(m-1)];  u3=u[3:m]
par(mfrow=c(1,2))
 plot(u1,u2, pch=20, xlim=c(0,.1), ylim=c(0,.1))
 plot(u1[u3<.01], u2[u3<.01], pch=20, xlim=0:1, ylim=0:1)
par(mfrow=c(1,1))

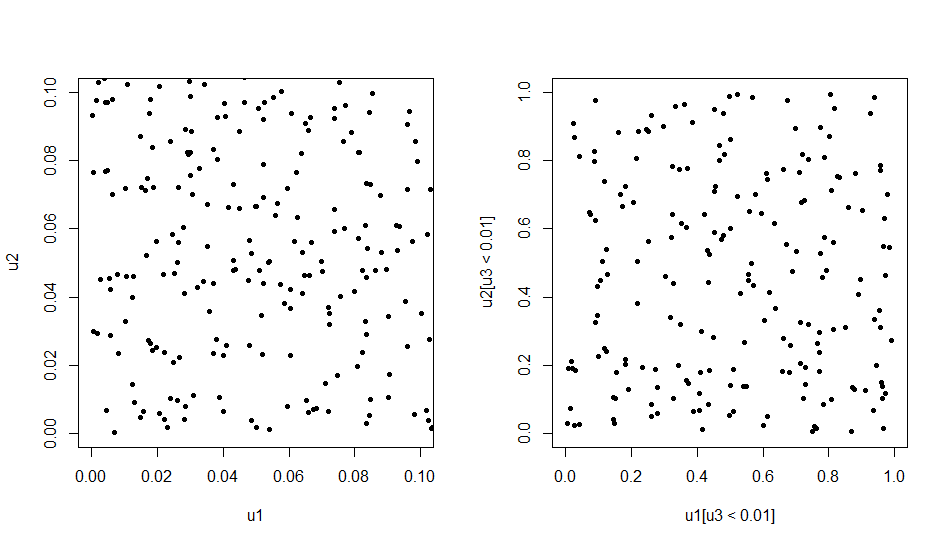
Below, plotting regions are the same as above, and both panels seem to have points at random.

enter image description here

RANDU vs. runif in R (using Mersenne Twister). One preliminary test in vetting a pseudorandom number generator might be to look at the distribution of points in the unit cube.

# RANDU
a = 65539; d = 2^31; s = 11
m = 20000; r = numeric(m); r[1] = s
for (i in 1:(m-1)) {r[i+1] = (a*r[i]) %% d}
u = (r-.5)/(d-1)
u1 = u[1:(m-2)]; u2 = u[2:(m-1)];  u3=u[3:m]
par(mfrow=c(1,2))
 plot(u1,u2, pch=20, xlim=c(0,.1), ylim=c(0,.1))
 plot(u1[u3<.01], u2[u3<.01], pch=20, xlim=0:1, ylim=0:1)
par(mfrow=c(1,1))

In the figure below, the left panel shows "random" points in the square with vertices $(0,0), (0.1,0.1),$ which look OK. By contrast, points near one face of the unit cube indicate that points in the cube lie on only a few planes.

enter image description here

# 'runif' in R using Mersenne Twister 
set.seed(2021); m = 20000; u = runif(m)
u1 = u[1:(m-2)]; u2 = u[2:(m-1)];  u3=u[3:m]
par(mfrow=c(1,2))
 plot(u1,u2, pch=20, xlim=c(0,.1), ylim=c(0,.1))
 plot(u1[u3<.01], u2[u3<.01], pch=20, xlim=0:1, ylim=0:1)
par(mfrow=c(1,1))

Below, plotting regions are the same as above, and both panels seem to have points at random.
enter image description here

RANDU vs. runif in R (using Mersenne Twister). One preliminary test in vetting a pseudorandom number generator might be to look at the distribution of points in the unit cube.

# RANDU (multiplicative congruential generator)
a = 65539; d = 2^31; s = 11
m = 20000; r = numeric(m); r[1] = s
for (i in 1:(m-1)) {r[i+1] = (a*r[i]) %% d}
u = (r-.5)/(d-1)
u1 = u[1:(m-2)]; u2 = u[2:(m-1)];  u3=u[3:m]
par(mfrow=c(1,2))
 plot(u1,u2, pch=20, xlim=c(0,.1), ylim=c(0,.1))
 plot(u1[u3<.01], u2[u3<.01], pch=20, xlim=0:1, ylim=0:1)
par(mfrow=c(1,1))

In the figure below, the left panel shows "random" points in the square with vertices $(0,0), (0.1,0.1),$ which look OK. By contrast, points near one face of the unit cube indicate that points in the cube lie on only a few planes.

enter image description here

# 'runif' in R using Mersenne Twister 
set.seed(2021); m = 20000; u = runif(m)
u1 = u[1:(m-2)]; u2 = u[2:(m-1)];  u3=u[3:m]
par(mfrow=c(1,2))
 plot(u1,u2, pch=20, xlim=c(0,.1), ylim=c(0,.1))
 plot(u1[u3<.01], u2[u3<.01], pch=20, xlim=0:1, ylim=0:1)
par(mfrow=c(1,1))

Below, plotting regions are the same as above, and both panels seem to have points at random.
enter image description here

added 10 characters in body
Source Link
BruceET
  • 57.6k
  • 2
  • 36
  • 94

RANDU vs. runif in R (using Mersenne Twister). AOne preliminary test in vetting a pseudorandom number generator ismight be to look at the distribution of points in the unit cube.

# RANDU
a = 65539; d = 2^31; s = 11
m = 20000; r = numeric(m); r[1] = s
for (i in 1:(m-1)) {r[i+1] = (a*r[i]) %% d}
u = (r-.5)/(d-1)
u1 = u[1:(m-2)]; u2 = u[2:(m-1)];  u3=u[3:m]
par(mfrow=c(1,2))
 plot(u1,u2, pch=20, xlim=c(0,.1), ylim=c(0,.1))
 plot(u1[u3<.01], u2[u3<.01], pch=20, xlim=0:1, ylim=0:1)
par(mfrow=c(1,1))

In the figure below, the left panel shows "random" points in the square with vertices $(0,0), (0.1,0.1),$ which look OK. By contrast, points near one face of the unit cube indicate that points in the cube lie on only a few planes.

enter image description here

# 'runif' in R using Mersenne Twister 
set.seed(2021); m = 20000; u = runif(m)
u1 = u[1:(m-2)]; u2 = u[2:(m-1)];  u3=u[3:m]
par(mfrow=c(1,2))
 plot(u1,u2, pch=20, xlim=c(0,.1), ylim=c(0,.1))
 plot(u1[u3<.01], u2[u3<.01], pch=20, xlim=0:1, ylim=0:1)
par(mfrow=c(1,1))

HereBelow, plotting regions are the same as above, and both panels seem to have points at random.

enter image description here

RANDU vs. runif in R (using Mersenne Twister). A preliminary test in vetting a pseudorandom number generator is to look at the distribution of points in the unit cube.

# RANDU
a = 65539; d = 2^31; s = 11
m = 20000; r = numeric(m); r[1] = s
for (i in 1:(m-1)) {r[i+1] = (a*r[i]) %% d}
u = (r-.5)/(d-1)
u1 = u[1:(m-2)]; u2 = u[2:(m-1)];  u3=u[3:m]
par(mfrow=c(1,2))
 plot(u1,u2, pch=20, xlim=c(0,.1), ylim=c(0,.1))
 plot(u1[u3<.01], u2[u3<.01], pch=20, xlim=0:1, ylim=0:1)
par(mfrow=c(1,1))

In the figure below, the left panel shows "random" points in the square with vertices $(0,0), (0.1,0.1),$ which look OK. By contrast, points near one face of the unit cube indicate that points in the cube lie on only a few planes.

enter image description here

# 'runif' in R using Mersenne Twister 
set.seed(2021); m = 20000; u = runif(m)
u1 = u[1:(m-2)]; u2 = u[2:(m-1)];  u3=u[3:m]
par(mfrow=c(1,2))
 plot(u1,u2, pch=20, xlim=c(0,.1), ylim=c(0,.1))
 plot(u1[u3<.01], u2[u3<.01], pch=20, xlim=0:1, ylim=0:1)
par(mfrow=c(1,1))

Here, plotting regions are the same, and both panels seem to have points at random.

enter image description here

RANDU vs. runif in R (using Mersenne Twister). One preliminary test in vetting a pseudorandom number generator might be to look at the distribution of points in the unit cube.

# RANDU
a = 65539; d = 2^31; s = 11
m = 20000; r = numeric(m); r[1] = s
for (i in 1:(m-1)) {r[i+1] = (a*r[i]) %% d}
u = (r-.5)/(d-1)
u1 = u[1:(m-2)]; u2 = u[2:(m-1)];  u3=u[3:m]
par(mfrow=c(1,2))
 plot(u1,u2, pch=20, xlim=c(0,.1), ylim=c(0,.1))
 plot(u1[u3<.01], u2[u3<.01], pch=20, xlim=0:1, ylim=0:1)
par(mfrow=c(1,1))

In the figure below, the left panel shows "random" points in the square with vertices $(0,0), (0.1,0.1),$ which look OK. By contrast, points near one face of the unit cube indicate that points in the cube lie on only a few planes.

enter image description here

# 'runif' in R using Mersenne Twister 
set.seed(2021); m = 20000; u = runif(m)
u1 = u[1:(m-2)]; u2 = u[2:(m-1)];  u3=u[3:m]
par(mfrow=c(1,2))
 plot(u1,u2, pch=20, xlim=c(0,.1), ylim=c(0,.1))
 plot(u1[u3<.01], u2[u3<.01], pch=20, xlim=0:1, ylim=0:1)
par(mfrow=c(1,1))

Below, plotting regions are the same as above, and both panels seem to have points at random.

enter image description here

added 121 characters in body
Source Link
BruceET
  • 57.6k
  • 2
  • 36
  • 94

RANDU vs. runif in R (using Mersenne Twister). A preliminary test in vetting a pseudorandom number generator is to look at the distribution of points in the unit cube.

# RANDU
a = 65539; d = 2^31; s = 11
m = 20000; r = numeric(m); r[1] = s
for (i in 1:(m-1)) {r[i+1] = (a*r[i]) %% d}
u = (r-.5)/(d-1)
u1 = u[1:(m-2)]; u2 = u[2:(m-1)];  u3=u[3:m]
par(mfrow=c(1,2))
 plot(u1,u2, pch=20, xlim=c(0,.1), ylim=c(0,.1))
 plot(u1[u3<.01], u2[u3<.01], pch=20, xlim=0:1, ylim=0:1)
par(mfrow=c(1,1))

In the figure below, the left panel shows "random" points in the square with vertices $(0,0), (0.1,0.1),$ which look OK. By contrast, points near one face of the unit cube indicate that points in the cube lie on only a few planes.

enter image description here

# 'runif' in R using Mersenne Twister 
set.seed(2021); m = 20000; u = runif(m)
u1 = u[1:(m-2)]; u2 = u[2:(m-1)];  u3=u[3:m]
par(mfrow=c(1,2))
 plot(u1,u2, pch=20, xlim=c(0,.1), ylim=c(0,.1))
 plot(u1[u3<.01], u2[u3<.01], pch=20, xlim=0:1, ylim=0:1)
par(mfrow=c(1,1))

Here, plotting regions are the same, and both panels seem to have points at random.

enter image description here

RANDU vs. runif in R (using Mersenne Twister).

# RANDU
a = 65539; d = 2^31; s = 11
m = 20000; r = numeric(m); r[1] = s
for (i in 1:(m-1)) {r[i+1] = (a*r[i]) %% d}
u = (r-.5)/(d-1)
u1 = u[1:(m-2)]; u2 = u[2:(m-1)];  u3=u[3:m]
par(mfrow=c(1,2))
 plot(u1,u2, pch=20, xlim=c(0,.1), ylim=c(0,.1))
 plot(u1[u3<.01], u2[u3<.01], pch=20, xlim=0:1, ylim=0:1)
par(mfrow=c(1,1))

In the figure below, the left panel shows "random" points in the square with vertices $(0,0), (0.1,0.1),$ which look OK. By contrast, points near one face of the unit cube indicate that points in the cube lie on only a few planes.

enter image description here

# 'runif' in R using Mersenne Twister 
set.seed(2021); m = 20000; u = runif(m)
u1 = u[1:(m-2)]; u2 = u[2:(m-1)];  u3=u[3:m]
par(mfrow=c(1,2))
 plot(u1,u2, pch=20, xlim=c(0,.1), ylim=c(0,.1))
 plot(u1[u3<.01], u2[u3<.01], pch=20, xlim=0:1, ylim=0:1)
par(mfrow=c(1,1))

Here, plotting regions are the same, and both panels seem to have points at random.

enter image description here

RANDU vs. runif in R (using Mersenne Twister). A preliminary test in vetting a pseudorandom number generator is to look at the distribution of points in the unit cube.

# RANDU
a = 65539; d = 2^31; s = 11
m = 20000; r = numeric(m); r[1] = s
for (i in 1:(m-1)) {r[i+1] = (a*r[i]) %% d}
u = (r-.5)/(d-1)
u1 = u[1:(m-2)]; u2 = u[2:(m-1)];  u3=u[3:m]
par(mfrow=c(1,2))
 plot(u1,u2, pch=20, xlim=c(0,.1), ylim=c(0,.1))
 plot(u1[u3<.01], u2[u3<.01], pch=20, xlim=0:1, ylim=0:1)
par(mfrow=c(1,1))

In the figure below, the left panel shows "random" points in the square with vertices $(0,0), (0.1,0.1),$ which look OK. By contrast, points near one face of the unit cube indicate that points in the cube lie on only a few planes.

enter image description here

# 'runif' in R using Mersenne Twister 
set.seed(2021); m = 20000; u = runif(m)
u1 = u[1:(m-2)]; u2 = u[2:(m-1)];  u3=u[3:m]
par(mfrow=c(1,2))
 plot(u1,u2, pch=20, xlim=c(0,.1), ylim=c(0,.1))
 plot(u1[u3<.01], u2[u3<.01], pch=20, xlim=0:1, ylim=0:1)
par(mfrow=c(1,1))

Here, plotting regions are the same, and both panels seem to have points at random.

enter image description here

Source Link
BruceET
  • 57.6k
  • 2
  • 36
  • 94
Loading