Became Hot Network Question
deleted 19 characters in body; edited title
Source Link
whuber
  • 333.5k
  • 63
  • 792
  • 1.3k

How to properly visualize the change of variance of a bivariate Gaussian Bivariate distribution cut slicesliced along a fixed variable?

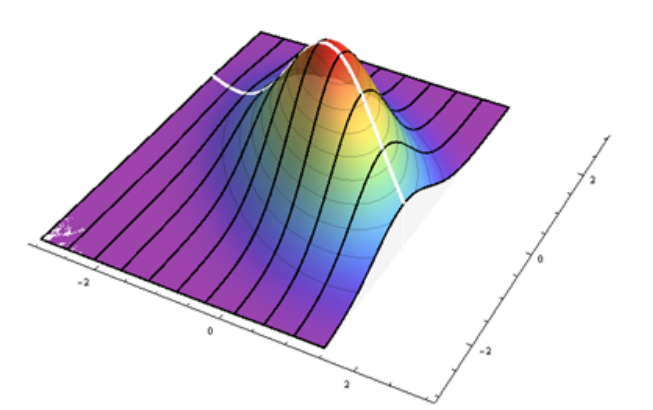
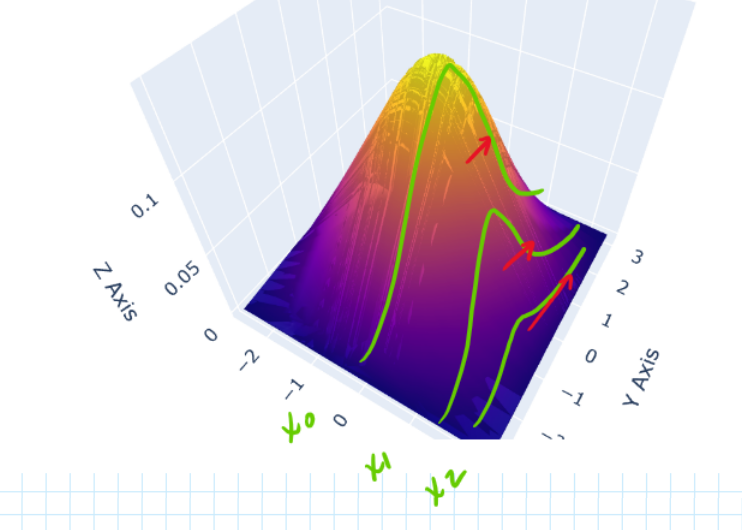
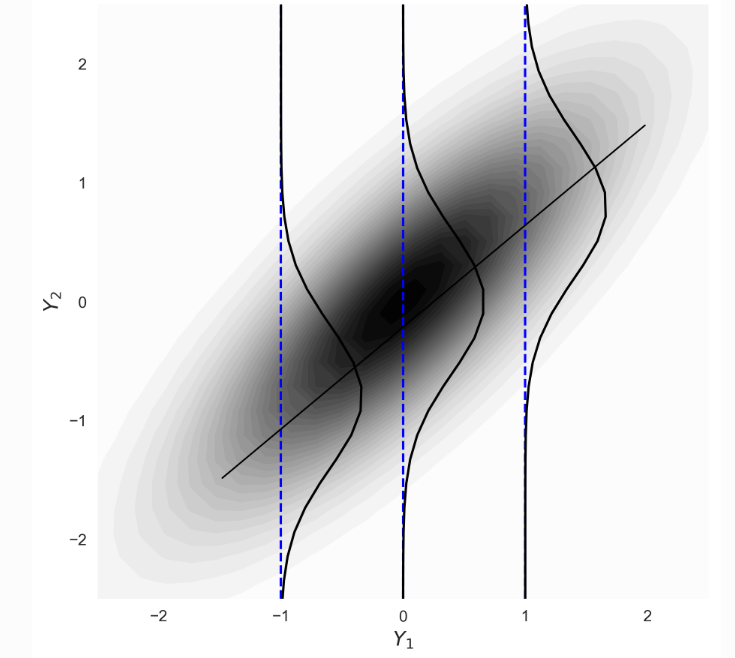
I'm trying to understand the basics of Gaussian Distribution. I struggle to visualice how the variance of the conditional probability of say P (Y|X) changes when X is fixed (given X and Y have a joint gaussian distribution). So, I have two pictures , in picture A from many sources shows that the variances dont change but the mean does. But it seems reasonable to me also to consider the conditional as a cut of de bivariate along one axis but now the variances does change, why is it so? I'm I wrongly thinking Picture B is the conditional?

Thanks for your time.

Picture A

Various posts shows that the variance is fixedVarious posts shows that the variance is fixed

[Picture updated thanks to contribution]

Picture B

Cuts along one variable ,. It seems that the variance (spread of black lines) increases or decreases according to a fixed X.

enter image description hereenter image description here

How to properly visualize the change of variance of Gaussian Bivariate distribution cut slice along a fixed variable?

I'm trying to understand the basics of Gaussian Distribution. I struggle to visualice how the variance of the conditional probability of say P (Y|X) changes when X is fixed (given X and Y have a joint gaussian distribution). So, I have two pictures , in picture A from many sources shows that the variances dont change but the mean does. But it seems reasonable to me also to consider the conditional as a cut of de bivariate along one axis but now the variances does change, why is it so? I'm I wrongly thinking Picture B is the conditional?

Thanks for your time.

Picture A

Various posts shows that the variance is fixed

[Picture updated thanks to contribution]

Picture B

Cuts along one variable , seems that the variance (spread of black lines) increases or decreases according to a fixed X

enter image description here

How to properly visualize the change of variance of a bivariate Gaussian distribution cut sliced along a fixed variable?

I'm trying to understand the basics of Gaussian Distribution. I struggle to visualice how the variance of the conditional probability of say P (Y|X) changes when X is fixed (given X and Y have a joint gaussian distribution). So, I have two pictures , in picture A from many sources shows that the variances dont change but the mean does. But it seems reasonable to me also to consider the conditional as a cut of de bivariate along one axis but now the variances does change, why is it so? I'm I wrongly thinking Picture B is the conditional?

Picture A

Various posts shows that the variance is fixed

[Picture updated thanks to contribution]

Picture B

Cuts along one variable. It seems that the variance (spread of black lines) increases or decreases according to a fixed X.
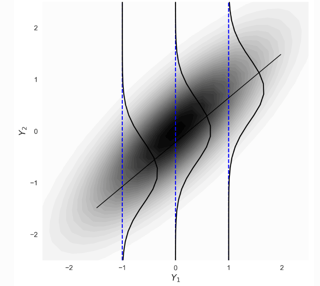
enter image description here

added 121 characters in body
Source Link

I'm trying to understand the basics of Gaussian Distribution. I struggle to visualice how the variance of the conditional probability of say P (Y|X) changes when X is fixed (given X and Y have a joint gaussian distribution). So, I have two pictures , in picture A from many sources shows that the variances dont change but the mean does. But it seems reasonable to me also to consider the conditional as a cut of de bivariate along one axis but now the variances does change, why is it so? I'm I wrongly thinking Picture B is the conditional?

Thanks for your time.

Picture A

Various posts shows that the variance is fixed

[Picture updated thanks to contribution]

Picture B

Cuts along one variable , seems that the variance increases or decreases Cuts along one variable , seems that the variance (spread of black lines) increases or decreases according to a fixed X

enter image description here

I'm trying to understand the basics of Gaussian Distribution. I struggle to visualice how the variance of the conditional probability of say P (Y|X) changes when X is fixed (given X and Y have a joint gaussian distribution). So, I have two pictures , in picture A from many sources shows that the variances dont change but the mean does. But it seems reasonable to me also to consider the conditional as a cut of de bivariate along one axis but now the variances does change, why is it so? I'm I wrongly thinking Picture B is the conditional?

Thanks for your time.

Picture A

Various posts shows that the variance is fixed

Picture B

Cuts along one variable , seems that the variance increases or decreases

I'm trying to understand the basics of Gaussian Distribution. I struggle to visualice how the variance of the conditional probability of say P (Y|X) changes when X is fixed (given X and Y have a joint gaussian distribution). So, I have two pictures , in picture A from many sources shows that the variances dont change but the mean does. But it seems reasonable to me also to consider the conditional as a cut of de bivariate along one axis but now the variances does change, why is it so? I'm I wrongly thinking Picture B is the conditional?

Thanks for your time.

Picture A

Various posts shows that the variance is fixed

[Picture updated thanks to contribution]

Picture B

Cuts along one variable , seems that the variance (spread of black lines) increases or decreases according to a fixed X

enter image description here

Source Link

How to properly visualize the change of variance of Gaussian Bivariate distribution cut slice along a fixed variable?

I'm trying to understand the basics of Gaussian Distribution. I struggle to visualice how the variance of the conditional probability of say P (Y|X) changes when X is fixed (given X and Y have a joint gaussian distribution). So, I have two pictures , in picture A from many sources shows that the variances dont change but the mean does. But it seems reasonable to me also to consider the conditional as a cut of de bivariate along one axis but now the variances does change, why is it so? I'm I wrongly thinking Picture B is the conditional?

Thanks for your time.

Picture A

Various posts shows that the variance is fixed

Picture B

Cuts along one variable , seems that the variance increases or decreases