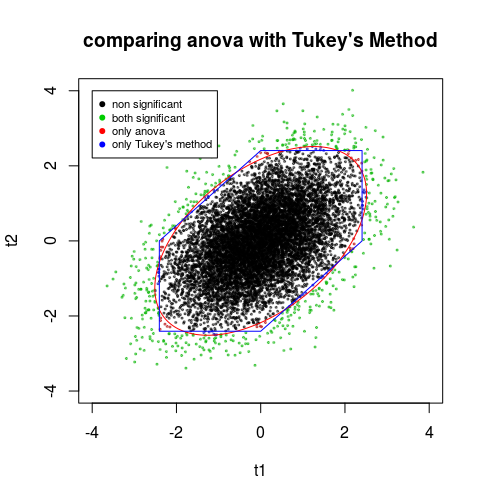
Here is a visualisation for testing the hypothesis $\mu_1 = \mu_2 = \mu_3$ which may be tested based on 3 seperate pairwise comparisons of the means by using individual t-tests based on t statistics that uses a pooled estimate for the deviation.
We simulate the distribution of the outcome of these t-tests for 3 samples of size 20 taken from a standard normal distribution. (See Comparing two, or more, independent paired t-tests) and we plot two of those t-statistics; the other is linearly dependent on the other two, $t_{1} - t_{2} + t_{3} = 0$. (Note: the signs in this linear dependency depend on how the t-statistics are computed).
What Tukey's method does, and also Anova, is defining a region such that given the hypothesis, $\mu_1=\mu_2=\mu_3$ (and the assumptions of normal distribution and equal variance), the outcome will pass some $p$ percent of the time outside the boundary. If the hypothesis is wrong then typically the outcome will be outside the boundary much more often.
Tukey's method uses the boundary based on the maximum magnitude of the t-statistics
$$q = \max(|t_1|,|t_2|,|t_3|)$$
Anova will use a boundary on the overall sizes of the t-statistics
$$F = \frac{t_1^2+t_2^2+t_3^2}{3}$$
Tukey's method will be more sensitive to situations where fewsome $\mu_i$ are different from the restin opposite directions (causing a large range). Anova will be more sensitive when multipleseveral $\mu_i$ are different. If only a few $\mu_i$ have values at far ends, then Tukey's method will already observe a significant large distance. Anova, will be more sensitive to situations when multiple $\mu_i$ cluster at the far ends.
However, my conclusion from this is that, in practice, if I observe that two groups have significantly different means, then the assumption that all k populations have the same mean must be false.
If two means are different then the hypothesis that 'all means are the same' is obviously false, but this doesn't mean that a statement like 'some means are the same' is false. We could have the situation where two means are the same $\mu_1 = \mu_2$, and one is different from the others, $\mu_3 \neq \mu_1$ and $\mu_3 \neq \mu_2$. In such case you will get small t-statistics, except for the ones that compare with the third group. You see this in the graphic where the pointy boundary for Tukey's method extends beyond the boundary for anova when two t-statistics are extreme and the other is nearly zero (Anova is more sensitive for that case).

