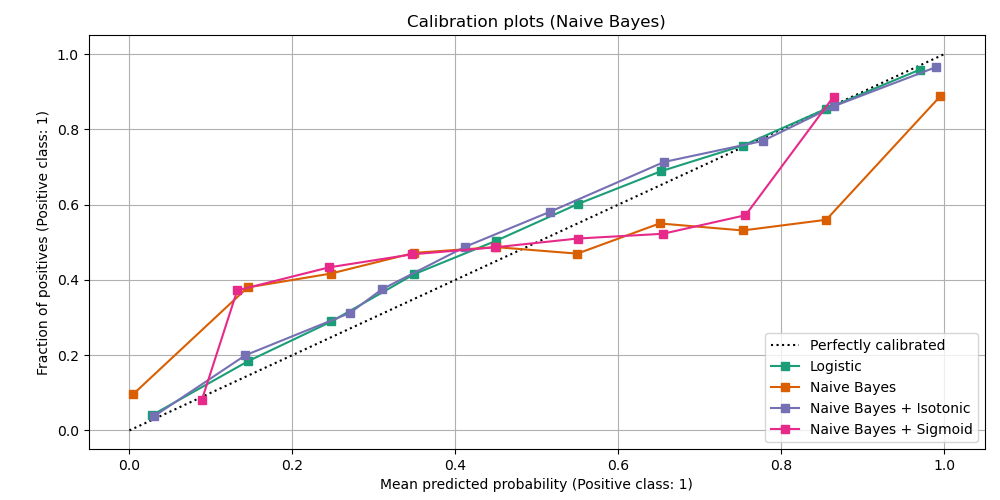
The sklearn documentation discusses calibration. One of the example models (in orange) is a naïve Bayes model that has a descending calibration curve, meaning that observations with larger estimated probabilities of occurrence actually occur less often.
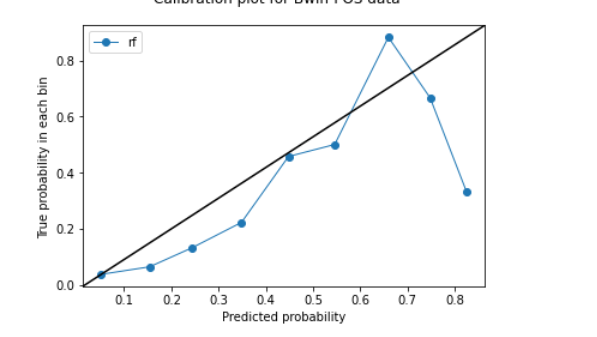
A member of this community has posted an example where the same phenomenon occurs but is even more visually extreme.
Those seem to be examples where the rankings are wrong.


