Became Hot Network Question
added 8 characters in body
Source Link

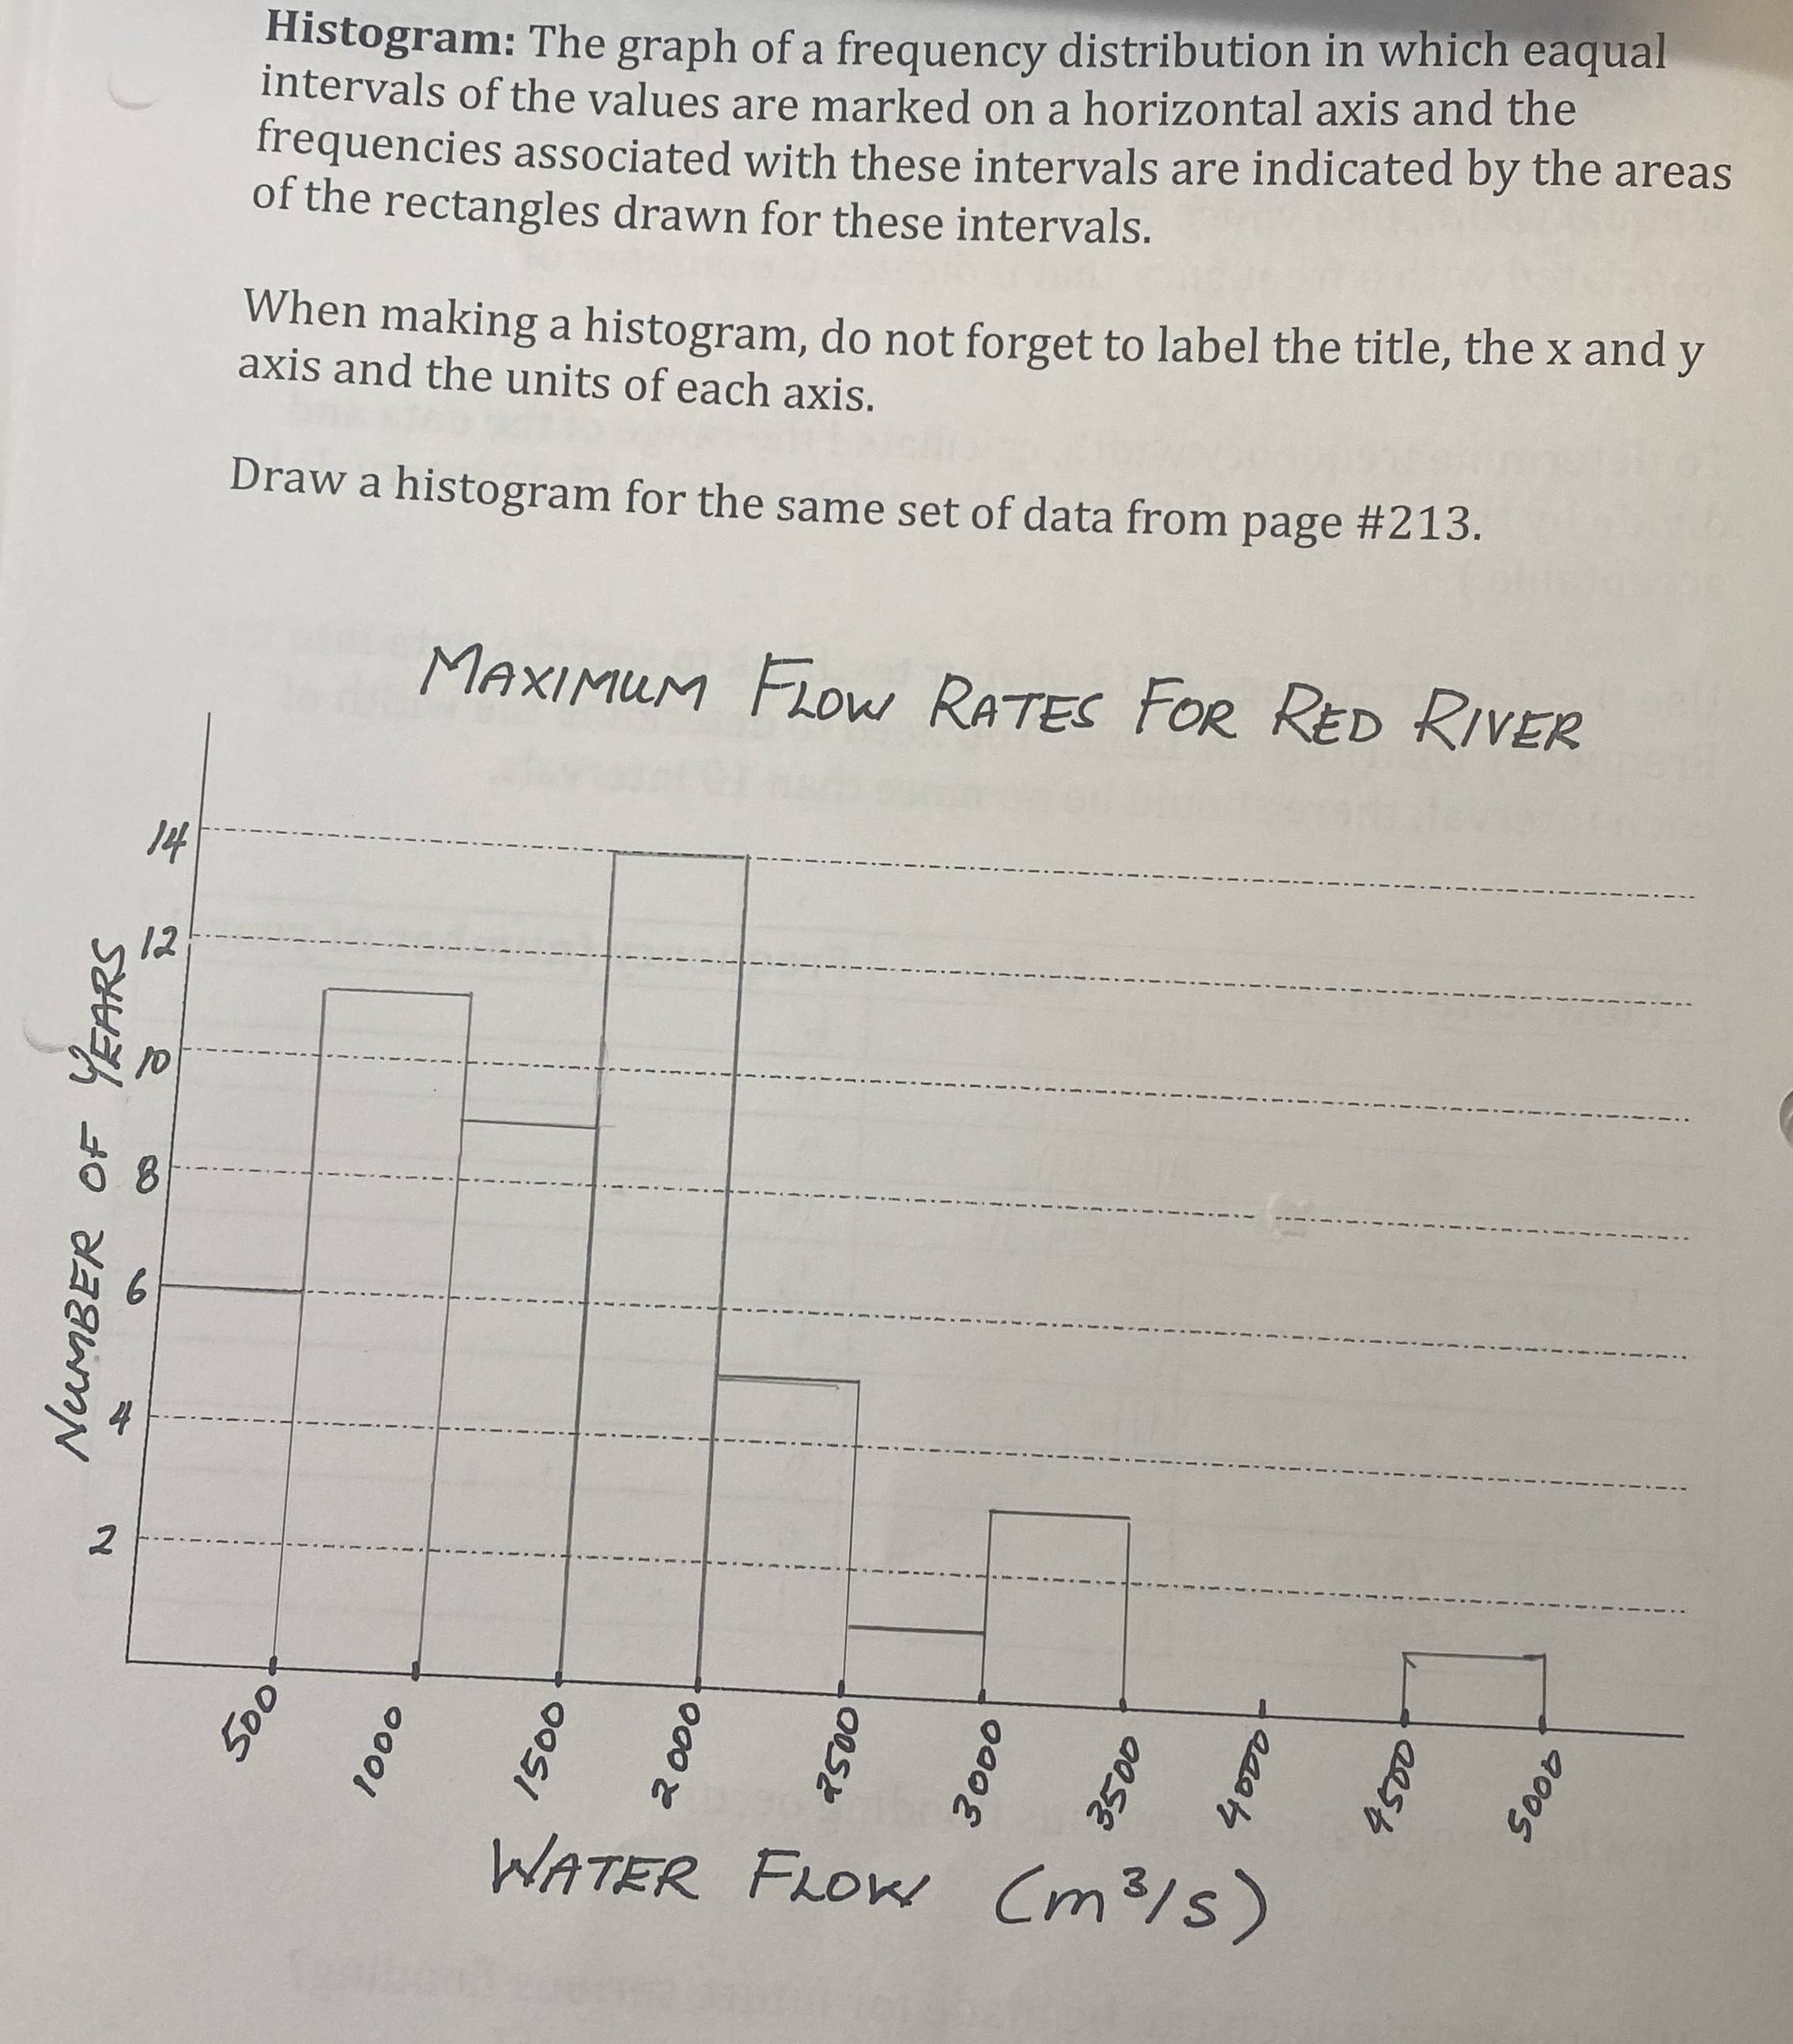
My friend asked me about histograms and sent me some examples given by their teachers and in the textbook. It is not like the histograms that I've learned at all. I was taught that the quantity represented by the area of the bars and the height of the bars represent frequency density and are calculated from bar width (for example, I would expect the "number of years" from image 2 to be represented by area of the bars, and not the y axis). Am I missing something? Image one is from a textbook while image two is from a worksheet.

textboook histogram example

example worksheet

My friend asked me about histograms and sent me some examples given by their teachers and in the textbook. It is not like the histograms that I've learned at all. I was taught that the quantity represented by the area of the bars and the height of the bars represent frequency and are calculated from bar width (for example, I would expect the "number of years" from image 2 to be represented by area of the bars, and not the y axis). Am I missing something? Image one is from a textbook while image two is from a worksheet.

textboook histogram example

example worksheet

My friend asked me about histograms and sent me some examples given by their teachers and in the textbook. It is not like the histograms that I've learned at all. I was taught that the quantity represented by the area of the bars and the height of the bars represent frequency density and are calculated from bar width (for example, I would expect the "number of years" from image 2 to be represented by area of the bars, and not the y axis). Am I missing something? Image one is from a textbook while image two is from a worksheet.

textboook histogram example

example worksheet

Source Link

Are these valid histograms?

My friend asked me about histograms and sent me some examples given by their teachers and in the textbook. It is not like the histograms that I've learned at all. I was taught that the quantity represented by the area of the bars and the height of the bars represent frequency and are calculated from bar width (for example, I would expect the "number of years" from image 2 to be represented by area of the bars, and not the y axis). Am I missing something? Image one is from a textbook while image two is from a worksheet.

textboook histogram example

example worksheet