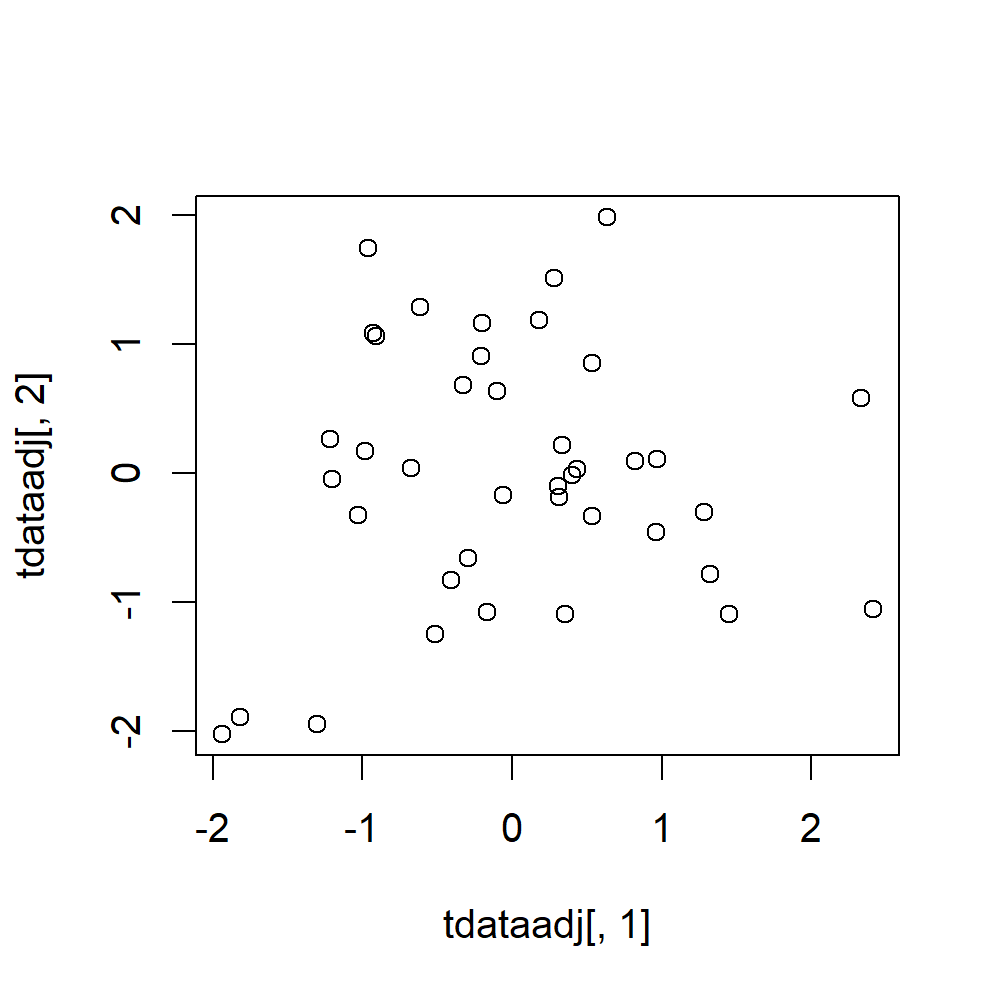
I wasn't able to find any R packages that gives a p-value for the hypothesis that relationship is non-zero, but! as https://stats.stackexchange.com/users/247274/dave said in the comments, you can look at the confidence intervals and see if they contain zero. I generated this dataset using the code in the question. The full set of points is given at the bottom of this answer.
 Basically I first generated the common random variable, then I added two different noises and labeled the sums X and Y and then standardized the variables so they have mean 0 and sd 1, and then I did this analysis:
> dem1adj = SimplyAgree::dem_reg(x = "X",
                               y = "Y",
                               data = tdataadj,
                               error.ratio = 1,
                               weighted = FALSE)
> dem1adj
Deming Regression with 95% C.I.
               coef    bias     se df lower.ci upper.ci         t p.value
Intercept 1.648e-17  0.3306 0.3043 38  -0.6159   0.6159 5.416e-17       1
Slope     1.000e+00 -2.2064 3.3213 38  -5.7237   7.7237 0.000e+00       1
You can see that it does recover the true slope perfectly, which is good, but the confidence interval is ridiculously wide. Comparing this to OLS regression results we see that it measures a different slope with much smaller confidence intervals:
> tlm1XYadj<-lm(Y~X,data=tdataadj)
> summary(tlm1XYadj)
Call:
lm(formula = Y ~ X, data = tdataadj)

Residuals:
     Min       1Q   Median       3Q      Max
-1.86093 -0.67556  0.01114  0.73277  1.93398

Coefficients:
             Estimate Std. Error t value Pr(>|t|)
(Intercept) 5.957e-18  1.596e-01   0.000    1.000
X           8.483e-02  1.616e-01   0.525    0.603

Residual standard error: 1.009 on 38 degrees of freedom
Multiple R-squared:  0.007196,  Adjusted R-squared:  -0.01893
F-statistic: 0.2754 on 1 and 38 DF,  p-value: 0.6028
> confint(tlm1XYadj)
                 2.5 %    97.5 %
(Intercept) -0.3231002 0.3231002
X           -0.2423850 0.4120476
And here's the data I used:
> tdataadj
             X           Y
1  -1.03162320 -0.32693143
2  -0.32622233  0.67991939
3   0.43389383  0.03415296
4   0.18279931  1.19163987
5  -0.05768708 -0.16677914
6  -0.93105396  1.08877898
7   0.96882546  0.11012679
8   0.53361944 -0.33525390
9   0.30807441 -0.09631317
10  0.31379470 -0.18302437
11  0.63422554  1.98778358
12  0.40106748 -0.01707597
13  0.33668007  0.21529383
14 -1.81610356 -1.89267178
15  2.33086692  0.58376939
16  1.32242220 -0.78551085
17 -1.21510257  0.26737799
18 -0.61251655  1.28683480
19 -0.09945225  0.63374035
20 -0.20994760  0.91045981
21  1.44842973 -1.09361737
22  0.27848282  1.51481991
23 -0.29062107 -0.66156765
24 -1.30265042 -1.94811983
25 -0.67633301  0.04255624
26  0.95956466 -0.45731566
27 -0.96100702  1.74357670
28  0.35176547 -1.08995059
29 -0.16483944 -1.07744841
30  2.40902229 -1.05429291
31  0.53104092  0.85336423
32 -0.97953605  0.17160045
33  1.28377097 -0.30414070
34 -1.20202696 -0.04712242
35 -1.93474927 -2.02505640
36 -0.51648326 -1.25078289
37 -0.90818395  1.06284063
38 -0.40711632 -0.82603933
39  0.81821206  0.09435079
40 -0.20330241  1.16602810
 Basically I first generated the common random variable, then I added two different noises and labeled the sums X and Y and then standardized the variables so they have mean 0 and sd 1, and then I did this analysis: