I am puzzled about the result of a 2-way ANOVA analysis. The factors are categorical and non-random and the sum of squares used is contrained type III (the choice of categorical or SS type does not appear to be important to the outcome though).
The data consists of 50 measurements, 2 levels in one factor, 5 in the other, and 5 replicates per treatment.
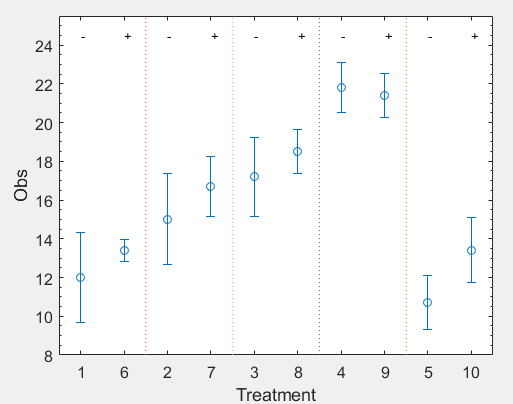
The following error plot illustrates mean +/- std dev for the individual treaments, blocked according to factor #2 (with two levels, -/+).
(edit: I substituted a boxplot with an error plot; comments further recommend simply a scatter plot. Note I chose to post a boxplot because this is the default visualization provided by MATLAB ANOVA functions; the documentation of these functions explains the meaning of the lines and symbols which may be somewhat unique).

In the above treatments 1-5 and 6-10 correspond to two levels (-/+) of factor #2 whereas treatments 1-5 differ in factor #1 (with levels matched by 6-10).
It appears from inspection that factor #1 has an effect but the same is hard to say for factor #2.
I ran the analysis in MATLAB as
[p,tbl,model] = anovan(msmnt,{var1,var2},"Model","interaction",'varnames',{'var 1','var 2'}); %Two-Way ANOVA
This is the output table:
| Source |
Sum Sq. |
d.f. |
Mean Sq. |
F |
Prob>F |
| factor 1 |
612.97 |
4 |
153.242 |
56.86 |
0 |
| factor 2 |
22.445 |
1 |
22.445 |
8.33 |
0.0063 |
| factor 1:factor 2 |
12.53 |
4 |
3.132 |
1.16 |
0.3418 |
| Error |
107.8 |
40 |
2.695 |
|
|
| Total |
755.745 |
49 |
|
|
|
There appears to be a significant effect (95% confidence) due to both factors (and no interaction).
I computed some of the ANOVA terms by hand and they (well, my computation) seem correct.
However if you look at the means for each of the two levels of factor #2:
| fact#2 level |
average |
sample std dev |
| - |
15.35 |
4.50 |
| + |
16.68 |
3.34 |
The error plot (simple inspection) and averages suggest that this is not a significant difference (no effect due to factor #2), but the ANOVA table seems to say otherwise.
This conflicting interpretation is confusing. What am I missing in my analysis? Is the ANOVA seeing something I don't?
(I suspect the reason is that the within-treatment variances are relatively small. However, if that is true, how do I determine whether individual pairs (eg 1-6, 2-7, etc, are significantly different?)

