The answer by @Nick Cox is very thorough and informative and I believe you should accept it.
Although Nick is correct that such a procedure does not exist, I wanted to provide you with some tools that may be at least partially useful for you. The short of it is, you can try to find a distribution (or several) which is consistent with the data you have (even if that is limited the the skew and kurtosis). After you have identified a reasonable distribution, you may be able to find a custom transformation that works for you. For example, if an Exponential distribution seems to provide a reasonable fit for $X$, then the transformation $U = -\log X$ will be approximately uniform on $(0, 1)$, which can be easily transformed to a logistic or Gaussian distribution (if you really really need this).
Cullen-Frey Plot
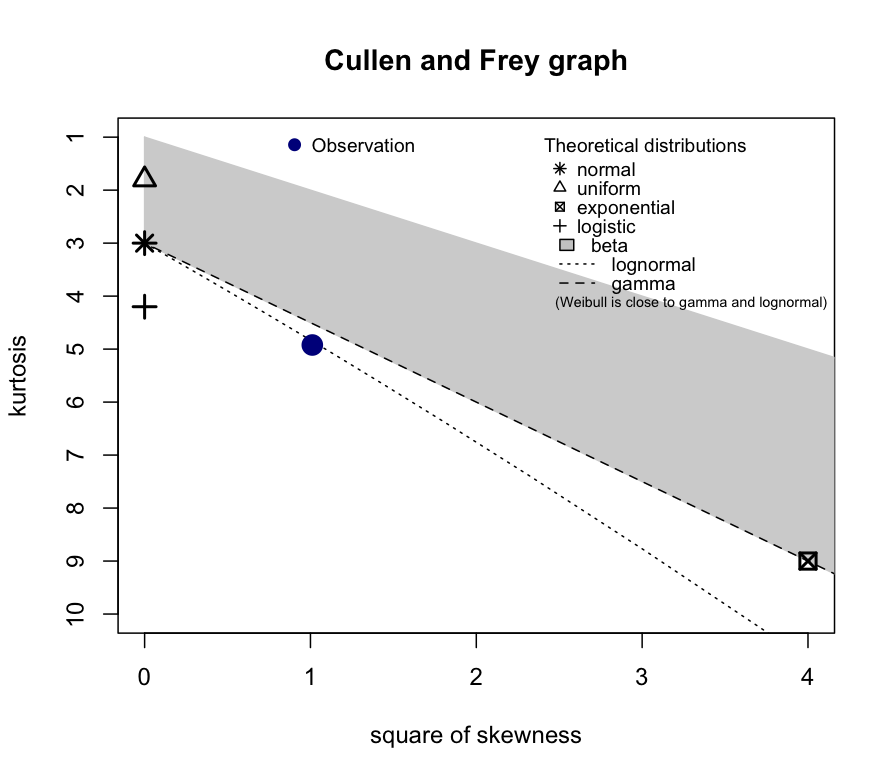
The R package fitdistrplus provides a nice implementation of the Cullen-Frey plot, which attempts to identify a distribution based only on the kurtosis and the square of the skewness.
# Simulate some data
n <- 500
y <- rgamma(n, 3, 1.5) + rlnorm(n, 1, 0.5)
#install.packages("fitdistrplus")
library(fitdistrplus)
descdist(y)

This figure suggests that a lognormal distribution may be roughly consistent with these data. This in-turn suggests that the transformation $\log X$ will yield data which may be approximately Gaussian.
The Normal-Wald Triangle Plot
The Normal-Wald distribution is a highly flexible 3-parameter distribution which can capture both left and right skew as well as a wide variety of tail behaviors.
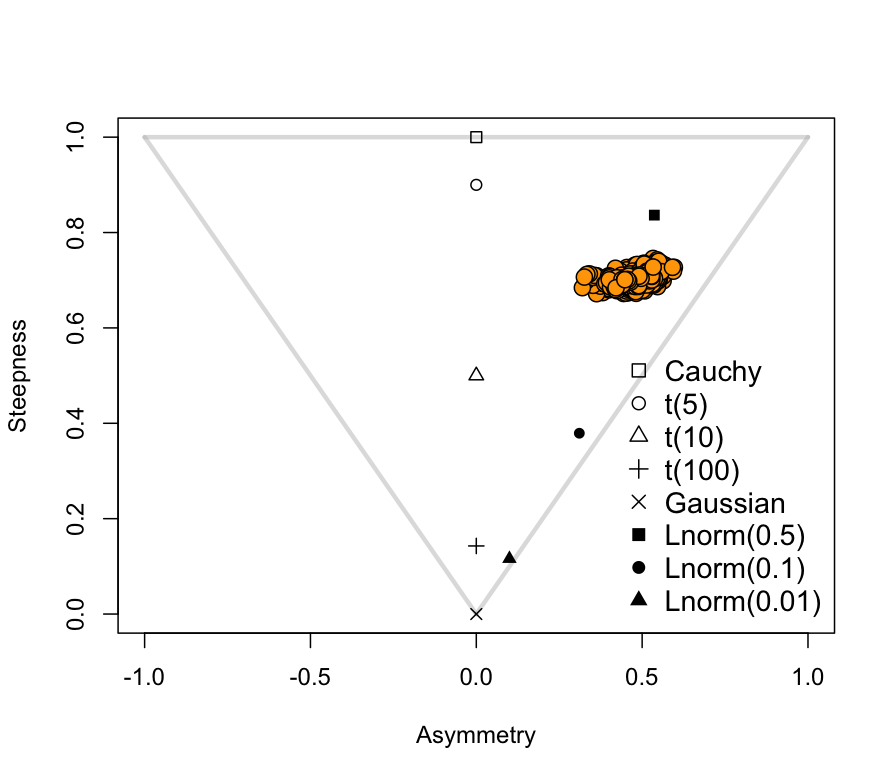
The Normal-Wald triangle plot is a useful tool for assessing the behavior of a data-set, using steepness (akin to kurtosis) and asymmetry (akin to skewness). See this paper or Sections 3.4.1 and SM6 of this paper for details.
library(devtools)
#devtools::install_github("knrumsey/GBASS")
library(GBASS)
X <- matrix(rep(1, n), ncol=1)
fit <- nwbass2(X, y,
               m_gamma=-1.4, s_gamma=82,
               m_beta=0, s_beta=0.5)
nw_triangle(fit, bg='orange', pch=21, cex=1.5, details=TRUE)

As with Cullen-Frey, this figure indicates that a log-normal distribution may be consistent with these data.


