added 135 characters in body
Source Link
Nick Cox
  • 59.4k
  • 8
  • 136
  • 212

This is a bundle of comments on the question: the graph alone requires answer form. Gratitude to the OP for posting their data to allow more analysis.

The principle of regressing on sine and cosine and using its results is good. In practice the data are too complicated and even contradictory to allow such a simple model to be successful or even helpful. (That regression is a routine calculation; suffice it to say that $R^2$ is $0.0172$, and so very disappointing.)

There are exact zeros and some negative values and a marked outlier in the outcome. I suspect that even quite experienced analysts may over-estimate the dependence on direction given sight of that outlier. An alternative is to work on a transformed scale. Here I use a cube root transformation.

Many readers will have met cube roots briefly and quite early in their mathematical education but may have had only occasional need to use them. At the risk of emphasising what is elementary or obvious: The cube root of a positive number is another positive number; the cube root of zero is zero; the cube root of a negative number is also a negative number (recall that the cube root of $-8$ is $-2$, for example). Hence cube roots preserve sign and pull in outliers in either tail. Readers wary of a cube root transformation as having too much ad hoc flavour are welcome to suggest an alternative (other than staying on the original scale, which is defensible, but needs caution).

Computational detail: Your software like mine may need that to be set up as $\text{sign}(y)\ |y|^{1/3}$, as calling up cube roots as specific powers may choke on an intermediate call to a logarithm routine given any negative arguments.

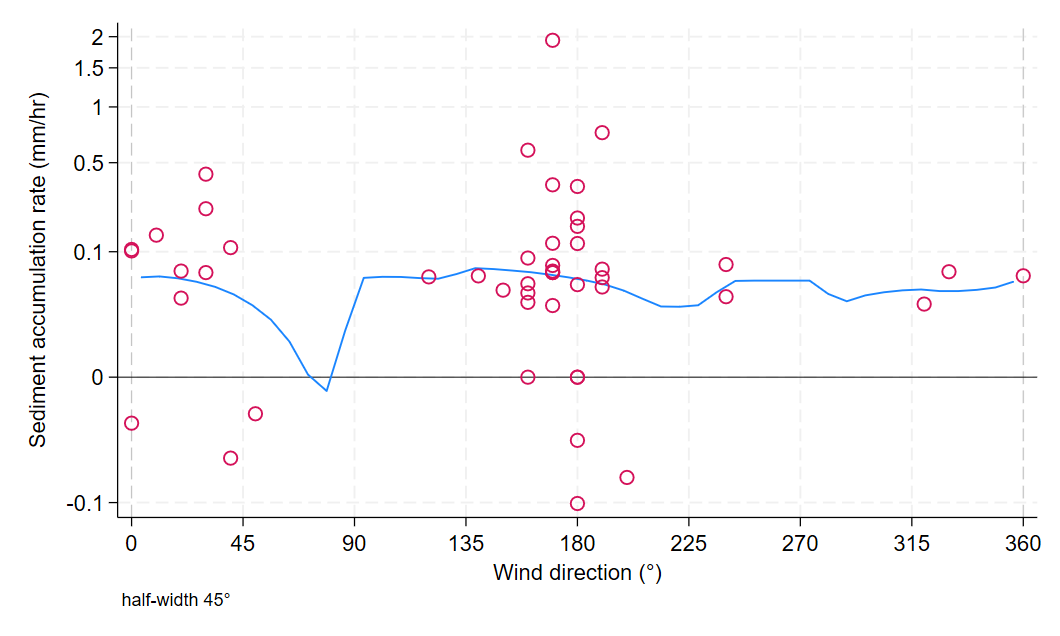
Here is a scatter plot of cube root of outcome versus direction with a biweight kernel smooth of half-width $45^\circ$. See e.g. here for more on that kernel and alternatives. The smoother unlike the graph looks around the corner, and so looks at outcomes with direction just West of North when the window has centre just East of North, and vice versa. A clear desideratum is that smooth for $0^\circ \equiv $ smooth for $360^\circ$, as these directions are one and the same. The smooth shows some kinks as an artefact of data points entering and leaving the window even though the kernel tapers to weight 0 at the ends of the window.

enter image description here

There are many geographical contexts in which wind direction can be bimodal, including location in a valley with up- and down-valley winds (anabatic and katabatic) or a coastal location with on-shore and off-shore winds.

I tried more complicated models than just one sine and one cosine term, but that was futile if not misguided.

My executive summary is that on these data the idea of a wind direction that maximises the outcome is unconvincing.

I used Stata: the only computational detail that could exercise readers is the need for a circular smoother that respects wrap-around at direction zero (here North, presumably; the need arises for any other choice of zero).

This is a bundle of comments on the question: the graph alone requires answer form. Gratitude to the OP for posting their data to allow more analysis.

The principle of regressing on sine and cosine and using its results is good. In practice the data are too complicated and even contradictory to allow such a simple model to be successful or even helpful. (That regression is a routine calculation; suffice it to say that $R^2$ is $0.0172$, and so very disappointing.)

There are exact zeros and some negative values and a marked outlier in the outcome. I suspect that even quite experienced analysts may over-estimate the dependence on direction given sight of that outlier. An alternative is to work on a transformed scale. Here I use a cube root transformation.

Many readers will have met cube roots briefly and quite early in their mathematical education but may have had only occasional need to use them. At the risk of emphasising what is elementary or obvious: The cube root of a positive number is another positive number; the cube root of zero is zero; the cube root of a negative number is also a negative number (recall that the cube root of $-8$ is $-2$, for example). Hence cube roots preserve sign and pull in outliers in either tail. Readers wary of a cube root transformation as having too much ad hoc flavour are welcome to suggest an alternative (other than staying on the original scale, which is defensible, but needs caution).

Computational detail: Your software like mine may need that to be set up as $\text{sign}(y)\ |y|^{1/3}$, as calling up cube roots as specific powers may choke on an intermediate call to a logarithm routine given any negative arguments.

Here is a scatter plot of cube root of outcome with a biweight kernel smooth of half-width $45^\circ$. The smoother unlike the graph looks around the corner, and so looks at outcomes with direction just West of North when the window has centre just East of North, and vice versa. A clear desideratum is that smooth for $0^\circ \equiv $ smooth for $360^\circ$, as these directions are one and the same. The smooth shows some kinks as an artefact of data points entering and leaving the window even though the kernel tapers to weight 0 at the ends of the window.

enter image description here

There are many geographical contexts in which wind direction can be bimodal, including location in a valley with up- and down-valley winds (anabatic and katabatic) or a coastal location with on-shore and off-shore winds.

I tried more complicated models than just one sine and one cosine term, but that was futile if not misguided.

My executive summary is that on these data the idea of a wind direction that maximises the outcome is unconvincing.

I used Stata: the only computational detail that could exercise readers is the need for a circular smoother that respects wrap-around at direction zero (here North, presumably; the need arises for any other choice of zero).

This is a bundle of comments on the question: the graph alone requires answer form. Gratitude to the OP for posting their data to allow more analysis.

The principle of regressing on sine and cosine and using its results is good. In practice the data are too complicated and even contradictory to allow such a simple model to be successful or even helpful. (That regression is a routine calculation; suffice it to say that $R^2$ is $0.0172$, and so very disappointing.)

There are exact zeros and some negative values and a marked outlier in the outcome. I suspect that even quite experienced analysts may over-estimate the dependence on direction given sight of that outlier. An alternative is to work on a transformed scale. Here I use a cube root transformation.

Many readers will have met cube roots briefly and quite early in their mathematical education but may have had only occasional need to use them. At the risk of emphasising what is elementary or obvious: The cube root of a positive number is another positive number; the cube root of zero is zero; the cube root of a negative number is also a negative number (recall that the cube root of $-8$ is $-2$, for example). Hence cube roots preserve sign and pull in outliers in either tail. Readers wary of a cube root transformation as having too much ad hoc flavour are welcome to suggest an alternative (other than staying on the original scale, which is defensible, but needs caution).

Computational detail: Your software like mine may need that to be set up as $\text{sign}(y)\ |y|^{1/3}$, as calling up cube roots as specific powers may choke on an intermediate call to a logarithm routine given any negative arguments.

Here is a scatter plot of cube root of outcome versus direction with a biweight kernel smooth of half-width $45^\circ$. See e.g. here for more on that kernel and alternatives. The smoother unlike the graph looks around the corner, and so looks at outcomes with direction just West of North when the window has centre just East of North, and vice versa. A clear desideratum is that smooth for $0^\circ \equiv $ smooth for $360^\circ$, as these directions are one and the same. The smooth shows some kinks as an artefact of data points entering and leaving the window even though the kernel tapers to weight 0 at the ends of the window.

enter image description here

There are many geographical contexts in which wind direction can be bimodal, including location in a valley with up- and down-valley winds (anabatic and katabatic) or a coastal location with on-shore and off-shore winds.

I tried more complicated models than just one sine and one cosine term, but that was futile if not misguided.

My executive summary is that on these data the idea of a wind direction that maximises the outcome is unconvincing.

I used Stata: the only computational detail that could exercise readers is the need for a circular smoother that respects wrap-around at direction zero (here North, presumably; the need arises for any other choice of zero).

deleted 1 character in body
Source Link
Nick Cox
  • 59.4k
  • 8
  • 136
  • 212

This is a bundle of comments on the question: the graph alone requires answer form. Gratitude to the OP for posting their data to allow more analysis.

The principle of regressing on sine and cosine and using its results is good. In practice the data are too complicated and even contradictory to allow such a simple model to be successful or even helpful. (That regression is a routine calculation; suffice it to say that $R^2$ is $0.0172$, and so very disappointing.)

There are exact zeros and some negative values and a marked outlier in the outcome. I suspect that even quite experienced analysts willmay over-estimate the dependence on direction given sight of that outlier. An alternative is to work on a transformed scale. Here I use a cube root transformation.

Many readers will have met cube roots briefly and quite early in their mathematical education but may have had only occasional need to use them. At the risk of emphasising what is elementary or obvious: The cube root of a positive number is another positive number; the cube root of zero is zero; the cube root of a negative number is also a negative number (recall that the cube root of $-8$ is $-2$, for example). Hence cube roots preserve sign and pull in outliers in either tail. Readers wary of a cube root transformation as having too much ad hoc flavour are welcome to suggest an alternative (other than staying on the original scale, which is defensible, but needs caution).

Computational detail: Your software like mine may need that to be set up as $\text{sign}(y)\ |y|^{1/3}$, as calling up cube roots as specific powers may choke on an intermediate call to a logarithm routine given any negative arguments.

Here is a scatter plot of cube root of outcome with a biweight kernel smooth of half-width $45^\circ$. The smoother unlike the graph looks around the corner, and so looks at outcomes with direction just West of North when the window has centre just East of North, and vice versa. A clear desideratum is that smooth for $0^\circ \equiv $ smooth for $360^\circ$, as these directions are one and the same. The smooth shows some kinks as an artefact of data points entering and leaving the window even though the kernel tapers to weight 0 at the ends of the window.

enter image description here

There are many geographical contexts in which wind direction can be bimodal, including location in a valley with up- and down-valley winds (anabatic and katabatic) or a coastal location with on-shore and off-shore winds.

I tried more complicated models than just one sine and one cosine term, but that was futile if not misguided.

My executive summary is that on these data the idea of a wind direction that maximises the outcome is unconvincing.

I used Stata: the only computational detail that could exercise readers is the need for a circular smoother that respects wrap-around at direction zero (here North, presumably; the need arises for any other choice of zero).

This is a bundle of comments on the question: the graph alone requires answer form. Gratitude to the OP for posting their data to allow more analysis.

The principle of regressing on sine and cosine and using its results is good. In practice the data are too complicated and even contradictory to allow such a simple model to be successful or even helpful. (That regression is a routine calculation; suffice it to say that $R^2$ is $0.0172$, and so very disappointing.)

There are exact zeros and some negative values and a marked outlier in the outcome. I suspect that even quite experienced analysts will over-estimate the dependence on direction given sight of that outlier. An alternative is to work on a transformed scale. Here I use a cube root transformation.

Many readers will have met cube roots briefly and quite early in their mathematical education but may have had only occasional need to use them. At the risk of emphasising what is elementary or obvious: The cube root of a positive number is another positive number; the cube root of zero is zero; the cube root of a negative number is also a negative number (recall that the cube root of $-8$ is $-2$, for example). Hence cube roots preserve sign and pull in outliers in either tail. Readers wary of a cube root transformation as having too much ad hoc flavour are welcome to suggest an alternative (other than staying on the original scale, which is defensible, but needs caution).

Computational detail: Your software like mine may need that to be set up as $\text{sign}(y)\ |y|^{1/3}$, as calling up cube roots as specific powers may choke on an intermediate call to a logarithm routine given any negative arguments.

Here is a scatter plot of cube root of outcome with a biweight kernel smooth of half-width $45^\circ$. The smoother unlike the graph looks around the corner, and so looks at outcomes with direction just West of North when the window has centre just East of North, and vice versa. A clear desideratum is that smooth for $0^\circ \equiv $ smooth for $360^\circ$, as these directions are one and the same. The smooth shows some kinks as an artefact of data points entering and leaving the window even though the kernel tapers to weight 0 at the ends of the window.

enter image description here

There are many geographical contexts in which wind direction can be bimodal, including location in a valley with up- and down-valley winds (anabatic and katabatic) or a coastal location with on-shore and off-shore winds.

I tried more complicated models than just one sine and one cosine term, but that was futile if not misguided.

My executive summary is that on these data the idea of a wind direction that maximises the outcome is unconvincing.

I used Stata: the only computational detail that could exercise readers is the need for a circular smoother that respects wrap-around at direction zero (here North, presumably; the need arises for any other choice of zero).

This is a bundle of comments on the question: the graph alone requires answer form. Gratitude to the OP for posting their data to allow more analysis.

The principle of regressing on sine and cosine and using its results is good. In practice the data are too complicated and even contradictory to allow such a simple model to be successful or even helpful. (That regression is a routine calculation; suffice it to say that $R^2$ is $0.0172$, and so very disappointing.)

There are exact zeros and some negative values and a marked outlier in the outcome. I suspect that even quite experienced analysts may over-estimate the dependence on direction given sight of that outlier. An alternative is to work on a transformed scale. Here I use a cube root transformation.

Many readers will have met cube roots briefly and quite early in their mathematical education but may have had only occasional need to use them. At the risk of emphasising what is elementary or obvious: The cube root of a positive number is another positive number; the cube root of zero is zero; the cube root of a negative number is also a negative number (recall that the cube root of $-8$ is $-2$, for example). Hence cube roots preserve sign and pull in outliers in either tail. Readers wary of a cube root transformation as having too much ad hoc flavour are welcome to suggest an alternative (other than staying on the original scale, which is defensible, but needs caution).

Computational detail: Your software like mine may need that to be set up as $\text{sign}(y)\ |y|^{1/3}$, as calling up cube roots as specific powers may choke on an intermediate call to a logarithm routine given any negative arguments.

Here is a scatter plot of cube root of outcome with a biweight kernel smooth of half-width $45^\circ$. The smoother unlike the graph looks around the corner, and so looks at outcomes with direction just West of North when the window has centre just East of North, and vice versa. A clear desideratum is that smooth for $0^\circ \equiv $ smooth for $360^\circ$, as these directions are one and the same. The smooth shows some kinks as an artefact of data points entering and leaving the window even though the kernel tapers to weight 0 at the ends of the window.

enter image description here

There are many geographical contexts in which wind direction can be bimodal, including location in a valley with up- and down-valley winds (anabatic and katabatic) or a coastal location with on-shore and off-shore winds.

I tried more complicated models than just one sine and one cosine term, but that was futile if not misguided.

My executive summary is that on these data the idea of a wind direction that maximises the outcome is unconvincing.

I used Stata: the only computational detail that could exercise readers is the need for a circular smoother that respects wrap-around at direction zero (here North, presumably; the need arises for any other choice of zero).

added 314 characters in body
Source Link
Nick Cox
  • 59.4k
  • 8
  • 136
  • 212

This is a bundle of comments on the question: the graph alone requires answer form. Gratitude to the OP for posting their data to allow more analysis.

The principle of regressing on sine and cosine and using its results is good. In practice the data are too complicated and even contradictory to allow such a simple model to be successful or even helpful. (That regression is a routine calculation; suffice it to say that $R^2$ is $0.0172$, and so very disappointing.)

There are exact zeros and some negative values and a marked outlier in the outcome. I suspect that even quite experienced analysts will over-estimate the dependence on direction given sight of that outlier. An alternative is to work on a transformed scale. Here I use a cube root transformation.

Many readers will have met cube roots briefly and quite early in their mathematical education but may have had only occasional need to use them. At the risk of emphasising what is elementary or obvious: The cube root of a positive number is another positive number; the cube root of zero is zero; the cube root of a negative number is also a negative number (recall that the cube root of $-8$ is $-2$, for example); hence. Hence cube roots preserve sign and pull in outliers in either tail. Readers wary of a cube rootsroot transformation as having too much ad hoc flavour are welcome to suggest an alternative (other than staying on the original scale, which is defensible, but needs caution).

Computational detail: Your software like mine may need that to be set up as $\text{sign}(y)\ |y|^{1/3}$, as calling up cube roots as specific powers may choke on an intermediate call to a logarithm routine given any negative arguments.

Here is a scatter plot of cube root of outcome with a smooth biweight kernel smooth of half-width $45^\circ$. The smoother unlike the graph looks around the corner, and so looks at outcomes with direction just West of North when the window has centre just East of North, and vice versa. A clear desideratum is that smooth for $0^\circ \equiv $ smooth for $360^\circ$, as these directions are one and the same. The smooth shows some kinks as an artefact of data points entering and leaving the window even though the kernel tapers to weight 0 at the ends of the window.

enter image description here

There are many geographical contexts in which wind direction can be bimodal, including location in a valley with up- and down-valley winds (anabatic and katabatic) or a coastal location with on-shore and off-shore winds.

I tried more complicated models than just one sine and one cosine term, but that was futile if not misguided.

My executive summary is that on these data the idea of a wind direction that maximises the outcome is unconvincing.

I used Stata: the only computational detail that could exercise readers is the need for a circular smoother that respects wrap-around at direction zero (here North, presumably; the need arises for any other choice of zero).

This is a bundle of comments on the question: the graph alone requires answer form. Gratitude to the OP for posting their data to allow more analysis.

The principle of regressing on sine and cosine and using its results is good. In practice the data are too complicated and even contradictory to allow such a simple model to be successful or even helpful. (That regression is a routine calculation; suffice it to say that $R^2$ is $0.0172$, and so very disappointing.)

There are exact zeros and some negative values and a marked outlier in the outcome. I suspect that even quite experienced analysts will over-estimate the dependence on direction given sight of that outlier. An alternative is to work on a transformed scale. Here I use a cube root transformation. The cube root of zero is zero; the cube root of a negative number is also a negative number (recall that the cube root of $-8$ is $-2$, for example); hence cube roots preserve sign and pull in outliers in either tail. Readers wary of cube roots as having ad hoc flavour are welcome to suggest an alternative (other than staying on the original scale, which is defensible).

Computational detail: Your software like mine may need that to be set up as $\text{sign}(y)\ |y|^{1/3}$, as calling up cube roots as specific powers may choke on an intermediate call to a logarithm routine given any negative arguments.

Here is a scatter plot of cube root of outcome with a smooth biweight kernel of half-width $45^\circ$. The smoother unlike the graph looks around the corner, and so looks at outcomes with direction just West of North when the window has centre just East of North, and vice versa. A clear desideratum is that smooth for $0^\circ \equiv $ smooth for $360^\circ$, as these directions are one and the same. The smooth shows some kinks as an artefact of data points entering and leaving the window even though the kernel tapers to weight 0 at the ends of the window.

enter image description here

There are many geographical contexts in which wind direction can be bimodal, including location in a valley with up- and down-valley winds (anabatic and katabatic) or a coastal location with on-shore and off-shore winds.

I tried more complicated models than just one sine and one cosine term, but that was futile if not misguided.

My executive summary is that on these data the idea of a wind direction that maximises the outcome is unconvincing.

I used Stata: the only computational detail that could exercise readers is the need for a circular smoother that respects wrap-around at direction zero (here North, presumably; the need arises for any other choice of zero).

This is a bundle of comments on the question: the graph alone requires answer form. Gratitude to the OP for posting their data to allow more analysis.

The principle of regressing on sine and cosine and using its results is good. In practice the data are too complicated and even contradictory to allow such a simple model to be successful or even helpful. (That regression is a routine calculation; suffice it to say that $R^2$ is $0.0172$, and so very disappointing.)

There are exact zeros and some negative values and a marked outlier in the outcome. I suspect that even quite experienced analysts will over-estimate the dependence on direction given sight of that outlier. An alternative is to work on a transformed scale. Here I use a cube root transformation.

Many readers will have met cube roots briefly and quite early in their mathematical education but may have had only occasional need to use them. At the risk of emphasising what is elementary or obvious: The cube root of a positive number is another positive number; the cube root of zero is zero; the cube root of a negative number is also a negative number (recall that the cube root of $-8$ is $-2$, for example). Hence cube roots preserve sign and pull in outliers in either tail. Readers wary of a cube root transformation as having too much ad hoc flavour are welcome to suggest an alternative (other than staying on the original scale, which is defensible, but needs caution).

Computational detail: Your software like mine may need that to be set up as $\text{sign}(y)\ |y|^{1/3}$, as calling up cube roots as specific powers may choke on an intermediate call to a logarithm routine given any negative arguments.

Here is a scatter plot of cube root of outcome with a biweight kernel smooth of half-width $45^\circ$. The smoother unlike the graph looks around the corner, and so looks at outcomes with direction just West of North when the window has centre just East of North, and vice versa. A clear desideratum is that smooth for $0^\circ \equiv $ smooth for $360^\circ$, as these directions are one and the same. The smooth shows some kinks as an artefact of data points entering and leaving the window even though the kernel tapers to weight 0 at the ends of the window.

enter image description here

There are many geographical contexts in which wind direction can be bimodal, including location in a valley with up- and down-valley winds (anabatic and katabatic) or a coastal location with on-shore and off-shore winds.

I tried more complicated models than just one sine and one cosine term, but that was futile if not misguided.

My executive summary is that on these data the idea of a wind direction that maximises the outcome is unconvincing.

I used Stata: the only computational detail that could exercise readers is the need for a circular smoother that respects wrap-around at direction zero (here North, presumably; the need arises for any other choice of zero).

Source Link
Nick Cox
  • 59.4k
  • 8
  • 136
  • 212
Loading