Clarification on variance vs. sd
Source Link
Jonas Lindeløv
  • 2.5k
  • 2
  • 26
  • 31

Background on bias correction constants

The standard deviation is calculated like this:

$$ SD = \left(\frac{1}{N-constant} \sum_{i=1}^N (x_i - \overline{x})^2\right)^{1/2} $$

Following Wikipedia's entry on the standard deviation, the biasedness of the estimation of a population SD given a sample depends on $constant$ in the following way:

  • $correction=0$: just sample sd, heavily biased to be smaller than population sd.
  • $correction=1$: Bessel's correction, less biased but still smaller.
  • $correction=1.5$: "rule of thumb", the best single value for an unbiased estimate.

Question

I simulated this and found that $\sqrt{2}$ is an even better value for $constant$, especially for small samples (n < 10) where $1.5$ overestimates population SD. Have I just discovered something fantastic or am I missing something here?

Simulation

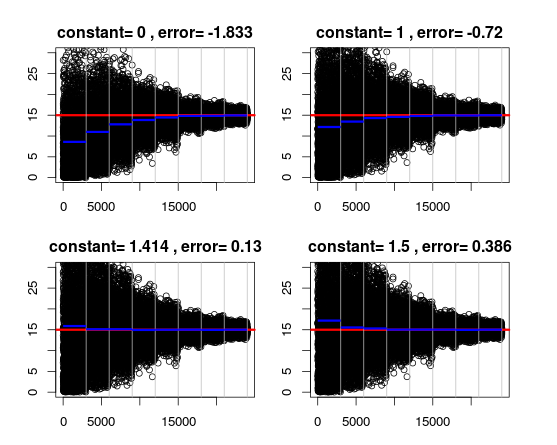
For each of the sample sizes $n=2,3,5,10,20,60,100,200$, I generated 3.000 samples using rnorm(n, 0, 15). For each sample size, I then estimated population SD using each of the above constants. Here's the result:
simulation results

Each plot is a different estimation constant. The "error" in the title is mean(sd.estimations - sd.real). The red line is the real SD. The blue line shows the estimated sd. The vertical gray lines mark change in sample size. Points show individual sd-estimations.

It is clear that $\sqrt{2}$ is superior to $1.5$. This is true for large sample sizes as well, even though it's not clear from this plot. Here's the R script that generated these plots.

Update and conclusion

$\sqrt{2}$ is close to the analytically correct solution but doesn't outperform it. It remains a heuristic which could be used out of laziness or for computational efficiency with small sample sizes.

Actually, the closest approximation depends on the sample size you want to calculate for. Here's a few optimal values for different sample sizes:

  • $4 < n < 10$: $\sqrt{2.15} = 1.47$ deviates with 0.4% at most.
  • $10 < n < 50$: $\sqrt{2.22} = 1.49$ deviates with 0.04 % at most.
  • $40 < n < 300$: $\sqrt{2.2465} = 1.4988$ deviates with 0.0025% at most.

As sample size increases, the constant approaches the "1.5 rule of thumb". Thus the conclusion is that $\sqrt(2)$ is quick-and-dirty for small sample sizes (but less dirty than Bessel!). For larger samples, reasonable approximations can be made with constants. 1.5.

And just to be clear: Bessel's correction is a very good approximation for large sample sizesstill the right way to get unbiased when estimating variance. The observations above only pertain to the estimation of the population standard deviation.

Background on bias correction constants

The standard deviation is calculated like this:

$$ SD = \left(\frac{1}{N-constant} \sum_{i=1}^N (x_i - \overline{x})^2\right)^{1/2} $$

Following Wikipedia's entry on the standard deviation, the biasedness of the estimation of a population SD given a sample depends on $constant$ in the following way:

  • $correction=0$: just sample sd, heavily biased to be smaller than population sd.
  • $correction=1$: Bessel's correction, less biased but still smaller.
  • $correction=1.5$: "rule of thumb", the best single value for an unbiased estimate.

Question

I simulated this and found that $\sqrt{2}$ is an even better value for $constant$, especially for small samples (n < 10) where $1.5$ overestimates population SD. Have I just discovered something fantastic or am I missing something here?

Simulation

For each of the sample sizes $n=2,3,5,10,20,60,100,200$, I generated 3.000 samples using rnorm(n, 0, 15). For each sample size, I then estimated population SD using each of the above constants. Here's the result:

simulation results

Each plot is a different estimation constant. The "error" in the title is mean(sd.estimations - sd.real). The red line is the real SD. The blue line shows the estimated sd. The vertical gray lines mark change in sample size. Points show individual sd-estimations.

It is clear that $\sqrt{2}$ is superior to $1.5$. This is true for large sample sizes as well, even though it's not clear from this plot. Here's the R script that generated these plots.

Update

$\sqrt{2}$ is close to the analytically correct solution but doesn't outperform it. It remains a heuristic which could be used out of laziness or for computational efficiency with small sample sizes.

Actually, the closest approximation depends on the sample size you want to calculate for. Here's a few optimal values for different sample sizes:

  • $4 < n < 10$: $\sqrt{2.15} = 1.47$ deviates with 0.4% at most.
  • $10 < n < 50$: $\sqrt{2.22} = 1.49$ deviates with 0.04 % at most.
  • $40 < n < 300$: $\sqrt{2.2465} = 1.4988$ deviates with 0.0025% at most.

As sample size increases, the constant approaches the "1.5 rule of thumb". Thus the conclusion is that $\sqrt(2)$ is quick-and-dirty for small sample sizes (but less dirty than Bessel!). For larger samples, reasonable approximations can be made with constants. 1.5 is a very good approximation for large sample sizes.

Background on bias correction constants

The standard deviation is calculated like this:

$$ SD = \left(\frac{1}{N-constant} \sum_{i=1}^N (x_i - \overline{x})^2\right)^{1/2} $$

Following Wikipedia's entry on the standard deviation, the biasedness of the estimation of a population SD given a sample depends on $constant$ in the following way:

  • $correction=0$: just sample sd, heavily biased to be smaller than population sd.
  • $correction=1$: Bessel's correction, less biased but still smaller.
  • $correction=1.5$: "rule of thumb", the best single value for an unbiased estimate.

Question

I simulated this and found that $\sqrt{2}$ is an even better value for $constant$, especially for small samples (n < 10) where $1.5$ overestimates population SD. Have I just discovered something fantastic or am I missing something here?

Simulation

For each of the sample sizes $n=2,3,5,10,20,60,100,200$, I generated 3.000 samples using rnorm(n, 0, 15). For each sample size, I then estimated population SD using each of the above constants. Here's the result:

simulation results

Each plot is a different estimation constant. The "error" in the title is mean(sd.estimations - sd.real). The red line is the real SD. The blue line shows the estimated sd. The vertical gray lines mark change in sample size. Points show individual sd-estimations.

It is clear that $\sqrt{2}$ is superior to $1.5$. This is true for large sample sizes as well, even though it's not clear from this plot. Here's the R script that generated these plots.

Update and conclusion

$\sqrt{2}$ is close to the analytically correct solution but doesn't outperform it. It remains a heuristic which could be used out of laziness or for computational efficiency with small sample sizes.

Actually, the closest approximation depends on the sample size you want to calculate for. Here's a few optimal values for different sample sizes:

  • $4 < n < 10$: $\sqrt{2.15} = 1.47$ deviates with 0.4% at most.
  • $10 < n < 50$: $\sqrt{2.22} = 1.49$ deviates with 0.04 % at most.
  • $40 < n < 300$: $\sqrt{2.2465} = 1.4988$ deviates with 0.0025% at most.

As sample size increases, the constant approaches the "1.5 rule of thumb". Thus the conclusion is that $\sqrt(2)$ is quick-and-dirty for small sample sizes. For larger samples, reasonable approximations can be made with 1.5.

And just to be clear: Bessel's correction is still the right way to get unbiased when estimating variance. The observations above only pertain to the estimation of the population standard deviation.

added 267 characters in body
Source Link
Jonas Lindeløv
  • 2.5k
  • 2
  • 26
  • 31

Background on bias correction constants

The standard deviation is calculated like this:

$$ SD = \left(\frac{1}{N-constant} \sum_{i=1}^N (x_i - \overline{x})^2\right)^{1/2} $$

Following Wikipedia's entry on the standard deviation, the biasedness of the estimation of a population SD given a sample depends on $constant$ in the following way:

  • $correction=0$: just sample sd, heavily biased to be smaller than population sd.
  • $correction=1$: Bessel's correction, less biased but still smaller.
  • $correction=1.5$: "rule of thumb", the best single value for an unbiased estimate.

Question

I simulated this and found that $\sqrt{2}$ is an even better value for $constant$, especially for small samples (n < 10) where $1.5$ overestimates population SD. Have I just discovered something fantastic or am I missing something here?

Simulation

For each of the sample sizes $n=2,3,5,10,20,60,100,200$, I generated 3.000 samples using rnorm(n, 0, 15). For each sample size, I then estimated population SD using each of the above constants. Here's the result:

simulation results

Each plot is a different estimation constant. The "error" in the title is mean(sd.estimations - sd.real). The red line is the real SD. The blue line shows the estimated sd. The vertical gray lines mark change in sample size. Points show individual sd-estimations.

It is clear that $\sqrt{2}$ is superior to $1.5$. This is true for large sample sizes as well, even though it's not clear from this plot. Here's the R script that generated these plots.

Update

$\sqrt{2}$ is close to the analytically correct solution but doesn't outperform it. It remains a heuristic which could be used out of laziness or for computational efficiency with small sample sizes.

Actually, the closest approximation depends on the sample size you want to calculate for. Here's a few optimal values for different sample sizes:

  • $4 < n < 10$: $\sqrt{2.15} = 1.47$ deviates with 0.4% at most.
  • $10 < n < 50$: $\sqrt{2.22} = 1.49$ deviates with 0.04 % at most.
  • $40 < n < 300$: $\sqrt{2.2465} = 1.4988$ deviates with 0.0025% at most.

As sample size increases, the constant approaches the "1.5 rule of thumb". Thus the conclusion is that $\sqrt(2)$ is quick-and-dirty for small sample sizes (but less dirty than Bessel!). For larger samples, reasonable approximations can be made with constants. 1.5 is a very good approximation for large sample sizes.

Background on bias correction constants

The standard deviation is calculated like this:

$$ SD = \left(\frac{1}{N-constant} \sum_{i=1}^N (x_i - \overline{x})^2\right)^{1/2} $$

Following Wikipedia's entry on the standard deviation, the biasedness of the estimation of a population SD given a sample depends on $constant$ in the following way:

  • $correction=0$: just sample sd, heavily biased to be smaller than population sd.
  • $correction=1$: Bessel's correction, less biased but still smaller.
  • $correction=1.5$: "rule of thumb", the best single value for an unbiased estimate.

Question

I simulated this and found that $\sqrt{2}$ is an even better value for $constant$, especially for small samples (n < 10) where $1.5$ overestimates population SD. Have I just discovered something fantastic or am I missing something here?

Simulation

For each of the sample sizes $n=2,3,5,10,20,60,100,200$, I generated 3.000 samples using rnorm(n, 0, 15). For each sample size, I then estimated population SD using each of the above constants. Here's the result:

simulation results

Each plot is a different estimation constant. The "error" in the title is mean(sd.estimations - sd.real). The red line is the real SD. The blue line shows the estimated sd. The vertical gray lines mark change in sample size. Points show individual sd-estimations.

It is clear that $\sqrt{2}$ is superior to $1.5$. This is true for large sample sizes as well, even though it's not clear from this plot. Here's the R script that generated these plots.

Update

$\sqrt{2}$ is close to the analytically correct solution but doesn't outperform it. It remains a heuristic which could be used out of laziness or for computational efficiency.

Actually, the closest approximation depends on the sample size you want to calculate for. Here's a few optimal values for different sample sizes:

  • $4 < n < 10$: $\sqrt{2.15} = 1.47$ deviates with 0.4% at most.
  • $10 < n < 50$: $\sqrt{2.22} = 1.49$ deviates with 0.04 % at most.
  • $40 < n < 300$: $\sqrt{2.2465} = 1.4988$ deviates with 0.0025% at most.

As sample size increases, the constant approaches the "1.5 rule of thumb".

Background on bias correction constants

The standard deviation is calculated like this:

$$ SD = \left(\frac{1}{N-constant} \sum_{i=1}^N (x_i - \overline{x})^2\right)^{1/2} $$

Following Wikipedia's entry on the standard deviation, the biasedness of the estimation of a population SD given a sample depends on $constant$ in the following way:

  • $correction=0$: just sample sd, heavily biased to be smaller than population sd.
  • $correction=1$: Bessel's correction, less biased but still smaller.
  • $correction=1.5$: "rule of thumb", the best single value for an unbiased estimate.

Question

I simulated this and found that $\sqrt{2}$ is an even better value for $constant$, especially for small samples (n < 10) where $1.5$ overestimates population SD. Have I just discovered something fantastic or am I missing something here?

Simulation

For each of the sample sizes $n=2,3,5,10,20,60,100,200$, I generated 3.000 samples using rnorm(n, 0, 15). For each sample size, I then estimated population SD using each of the above constants. Here's the result:

simulation results

Each plot is a different estimation constant. The "error" in the title is mean(sd.estimations - sd.real). The red line is the real SD. The blue line shows the estimated sd. The vertical gray lines mark change in sample size. Points show individual sd-estimations.

It is clear that $\sqrt{2}$ is superior to $1.5$. This is true for large sample sizes as well, even though it's not clear from this plot. Here's the R script that generated these plots.

Update

$\sqrt{2}$ is close to the analytically correct solution but doesn't outperform it. It remains a heuristic which could be used out of laziness or for computational efficiency with small sample sizes.

Actually, the closest approximation depends on the sample size you want to calculate for. Here's a few optimal values for different sample sizes:

  • $4 < n < 10$: $\sqrt{2.15} = 1.47$ deviates with 0.4% at most.
  • $10 < n < 50$: $\sqrt{2.22} = 1.49$ deviates with 0.04 % at most.
  • $40 < n < 300$: $\sqrt{2.2465} = 1.4988$ deviates with 0.0025% at most.

As sample size increases, the constant approaches the "1.5 rule of thumb". Thus the conclusion is that $\sqrt(2)$ is quick-and-dirty for small sample sizes (but less dirty than Bessel!). For larger samples, reasonable approximations can be made with constants. 1.5 is a very good approximation for large sample sizes.

deleted 105 characters in body
Source Link
Jonas Lindeløv
  • 2.5k
  • 2
  • 26
  • 31

Background on bias correction constants

The standard deviation is calculated like this:

$$ SD = \left(\frac{1}{N-constant} \sum_{i=1}^N (x_i - \overline{x})^2\right)^{1/2} $$

Following Wikipedia's entry on the standard deviation, the biasedness of the estimation of a population SD given a sample depends on $constant$ in the following way:

  • $correction=0$: just sample sd, heavily biased to be smaller than population sd.
  • $correction=1$: Bessel's correction, less biased but still smaller.
  • $correction=1.5$: "rule of thumb", the best single value for an unbiased estimate.

Question

I simulated this and found that $\sqrt{2}$ is an even better value for $constant$, especially for small samples (n < 10) where $1.5$ overestimates population SD. Have I just discovered something fantastic or am I missing something here?

Simulation

For each of the sample sizes $n=2,3,5,10,20,60,100,200$, I generated 3.000 samples using rnorm(n, 0, 15). For each sample size, I then estimated population SD using each of the above constants. Here's the result:

simulation results

Each plot is a different estimation constant. The "error" in the title is mean(sd.estimations - sd.real). The red line is the real SD. The blue line shows the estimated sd. The vertical gray lines mark change in sample size. Points show individual sd-estimations.

It is clear that $\sqrt{2}$ is superior to $1.5$. This is true for large sample sizes as well, even though it's not clear from this plot. Here's the R script that generated these plots.

Update

$\sqrt{2}$ is close to the analytically correct solution but doesn't outperform it. It remains a heuristic which could be used out of laziness or for computational efficiency. In all cases, single constants (like 1 or 1.5 or 1.47) are outperformed by square roots, as indicated in the simulations above.

Actually, the closest approximation depends on the sample size you want to calculate for. Here's a few optimal values for different sample sizes:

  • $4 < n < 10$: $\sqrt{2.15}$$\sqrt{2.15} = 1.47$ deviates with 0.4% at most.
  • $10 < n < 50$: $\sqrt{2.22}$$\sqrt{2.22} = 1.49$ deviates with 0.04 % at most.
  • $40 < n < 300$: $\sqrt{2.2465}$$\sqrt{2.2465} = 1.4988$ deviates with 0.0025% at most.

As sample size increases, the constant approaches the "1.5 rule of thumb".

Background on bias correction constants

The standard deviation is calculated like this:

$$ SD = \left(\frac{1}{N-constant} \sum_{i=1}^N (x_i - \overline{x})^2\right)^{1/2} $$

Following Wikipedia's entry on the standard deviation, the biasedness of the estimation of a population SD given a sample depends on $constant$ in the following way:

  • $correction=0$: just sample sd, heavily biased to be smaller than population sd.
  • $correction=1$: Bessel's correction, less biased but still smaller.
  • $correction=1.5$: "rule of thumb", the best single value for an unbiased estimate.

Question

I simulated this and found that $\sqrt{2}$ is an even better value for $constant$, especially for small samples (n < 10) where $1.5$ overestimates population SD. Have I just discovered something fantastic or am I missing something here?

Simulation

For each of the sample sizes $n=2,3,5,10,20,60,100,200$, I generated 3.000 samples using rnorm(n, 0, 15). For each sample size, I then estimated population SD using each of the above constants. Here's the result:

simulation results

Each plot is a different estimation constant. The "error" in the title is mean(sd.estimations - sd.real). The red line is the real SD. The blue line shows the estimated sd. The vertical gray lines mark change in sample size. Points show individual sd-estimations.

It is clear that $\sqrt{2}$ is superior to $1.5$. This is true for large sample sizes as well, even though it's not clear from this plot. Here's the R script that generated these plots.

Update

$\sqrt{2}$ is close to the analytically correct solution but doesn't outperform it. It remains a heuristic which could be used out of laziness or for computational efficiency. In all cases, single constants (like 1 or 1.5 or 1.47) are outperformed by square roots, as indicated in the simulations above.

Actually, the closest approximation depends on the sample size you want to calculate for. Here's a few optimal values for different sample sizes:

  • $4 < n < 10$: $\sqrt{2.15}$ deviates with 0.4% at most.
  • $10 < n < 50$: $\sqrt{2.22}$ deviates with 0.04 % at most.
  • $40 < n < 300$: $\sqrt{2.2465}$ deviates with 0.0025% at most.

Background on bias correction constants

The standard deviation is calculated like this:

$$ SD = \left(\frac{1}{N-constant} \sum_{i=1}^N (x_i - \overline{x})^2\right)^{1/2} $$

Following Wikipedia's entry on the standard deviation, the biasedness of the estimation of a population SD given a sample depends on $constant$ in the following way:

  • $correction=0$: just sample sd, heavily biased to be smaller than population sd.
  • $correction=1$: Bessel's correction, less biased but still smaller.
  • $correction=1.5$: "rule of thumb", the best single value for an unbiased estimate.

Question

I simulated this and found that $\sqrt{2}$ is an even better value for $constant$, especially for small samples (n < 10) where $1.5$ overestimates population SD. Have I just discovered something fantastic or am I missing something here?

Simulation

For each of the sample sizes $n=2,3,5,10,20,60,100,200$, I generated 3.000 samples using rnorm(n, 0, 15). For each sample size, I then estimated population SD using each of the above constants. Here's the result:

simulation results

Each plot is a different estimation constant. The "error" in the title is mean(sd.estimations - sd.real). The red line is the real SD. The blue line shows the estimated sd. The vertical gray lines mark change in sample size. Points show individual sd-estimations.

It is clear that $\sqrt{2}$ is superior to $1.5$. This is true for large sample sizes as well, even though it's not clear from this plot. Here's the R script that generated these plots.

Update

$\sqrt{2}$ is close to the analytically correct solution but doesn't outperform it. It remains a heuristic which could be used out of laziness or for computational efficiency.

Actually, the closest approximation depends on the sample size you want to calculate for. Here's a few optimal values for different sample sizes:

  • $4 < n < 10$: $\sqrt{2.15} = 1.47$ deviates with 0.4% at most.
  • $10 < n < 50$: $\sqrt{2.22} = 1.49$ deviates with 0.04 % at most.
  • $40 < n < 300$: $\sqrt{2.2465} = 1.4988$ deviates with 0.0025% at most.

As sample size increases, the constant approaches the "1.5 rule of thumb".

deleted 3 characters in body
Source Link
Jonas Lindeløv
  • 2.5k
  • 2
  • 26
  • 31
Loading
Wrote update
Source Link
Jonas Lindeløv
  • 2.5k
  • 2
  • 26
  • 31
Loading
corrected obvious math typo
Source Link
Alecos Papadopoulos
  • 60.7k
  • 8
  • 154
  • 278
Loading
Source Link
Jonas Lindeløv
  • 2.5k
  • 2
  • 26
  • 31
Loading