3
$\begingroup$

The independence gap is defined as

$$\phi_{X_1, \ldots, X_n}(x_1, \ldots, x_n) \triangleq F_{X_1, \ldots, X_n}(x_1, \ldots, x_n) - \prod_{j=1}^n F_{X_j}(x_j)$$

where $F_{X_1, \ldots, X_n}(x_1, \ldots, x_n)$ is the joint CDF over random variables $X_1, \ldots, X_n$ and $F_{X_j}(x_j)$ is the marginal CDF over the random variable $X_j$.

When I first considered this function I figured that the image would be $[-1,1]$ from plugging in the min/max values in $[0,1]$ for the respective joint and marginal probabilities.

$$\underbrace{1}_{\text{joint}} - \underbrace{0}_{\text{marginals}} = \underbrace{1}_{\text{independence gap}}$$ $$\underbrace{0}_{\text{joint}} - \underbrace{1}_{\text{marginals}} = \underbrace{-1}_{\text{independence gap}}$$

But then I started considering the Frechet inequalities. If I started with the marginals only, I could put an interval on the possible values of the joint probability without any assumption of statistical independence. And then compute an interval for independence gap using basic interval arithmetic.

What I found was that for pairs of variables that the independence gaps were more tightly bounded than I had expected from the above calculations. Intead of $\phi_{X_1, X_2} \in [-1,1]$ I found that $\phi_{X_1, X_2} \in \left[ -\frac{1}{4}, \frac{1}{4} \right]$. From what I understand the Frechet inequalities don't make any special assumptions, but I could be wrong.

Is my inference correct that the pairwise independence gap is bounded to $\left[-\frac{1}{4},\frac{1}{4}\right]$?

Question

Are the bounds on the independence gap different as a function the number of variables $n \geq 2$?

$\endgroup$
3
  • $\begingroup$ Maybe the AM-GM inequality can be leveraged somehow? $$\sum_{k=1}^n P(A_k) \geq n \sqrt[n]{\prod_{k}^n P(A_k)}$$ $\endgroup$
    – Galen
    Commented Aug 2, 2023 at 17:12
  • $\begingroup$ We also know the that sum of the probabilities can be no more than $n$ and less than zero. $$n \geq \sum_{k=1}^n P(A_k) \geq 0$$ $\endgroup$
    – Galen
    Commented Aug 2, 2023 at 17:13
  • $\begingroup$ And we know that the product of the marginals is still between zero and one. $$1 \geq \prod_{k}^kP(A_k) \geq 0$$ $\endgroup$
    – Galen
    Commented Aug 2, 2023 at 17:14

3 Answers 3

3
$\begingroup$

This is not just a question about cumulative distribution functions but about events.

What is the possible range of the difference

$$P\left(A_1 \text{ and } A_2\right) - P\left(A_1\right)P\left(A_2\right) $$

or more generally for $n$ events

$$P\left(\bigwedge_{i=1}^n A_i\right) - \prod_{i =1}^n P\left(A_i\right)$$


We can write the individual events as

$$P\left(A_i\right) = P\left(\bigwedge_{i=1}^n A_i\right) + P\left(A_i \text{ and } \bigvee_{i=1}^n \lnot A_i\right)$$

that is, the probability of all $A_i$ plus the probability of $A_i$ when one or more of the other $A_i$ are not the case.

  • The lowest minimum occurs when $P\left(\bigwedge_{i=1}^n A_i\right) = 0$ and $P\left(A_i \text{ and } \bigvee_{i=1}^n \lnot A_i\right) = 1-\frac{1}{n}$. This is when there is always exactly one of the events $A_i$ not true, which needs to occur with probability $\frac{1}{n}$ if we share the probabilities equally (which leads to the largest product). Then

    $$\text{minimum bound} = -\left(1-\frac{1}{n} \right)^n$$

  • The largest maximum occur when the events are fully dependent and for all $i$ we have $P\left(A_i\right) = P\left(\bigwedge_{i=1}^n A_i\right)$ which leads to the gap being equal to

    $$\text{fully correlated gap} = P\left(\bigwedge_{i=1}^n A_i \right) - P\left(\bigwedge_{i=1}^n A_i\right)^n$$

    which has a maximum in $P\left(\bigwedge_{i=1}^n A_i\right))= (\frac{1}{n})^{\frac{1}{n-1}}$ and

    $$\text{maximum bound} = \left(\frac{1}{n}\right)^{\frac{1}{n-1}} - \left(\frac{1}{n}\right)^{\frac{n}{n-1}} $$

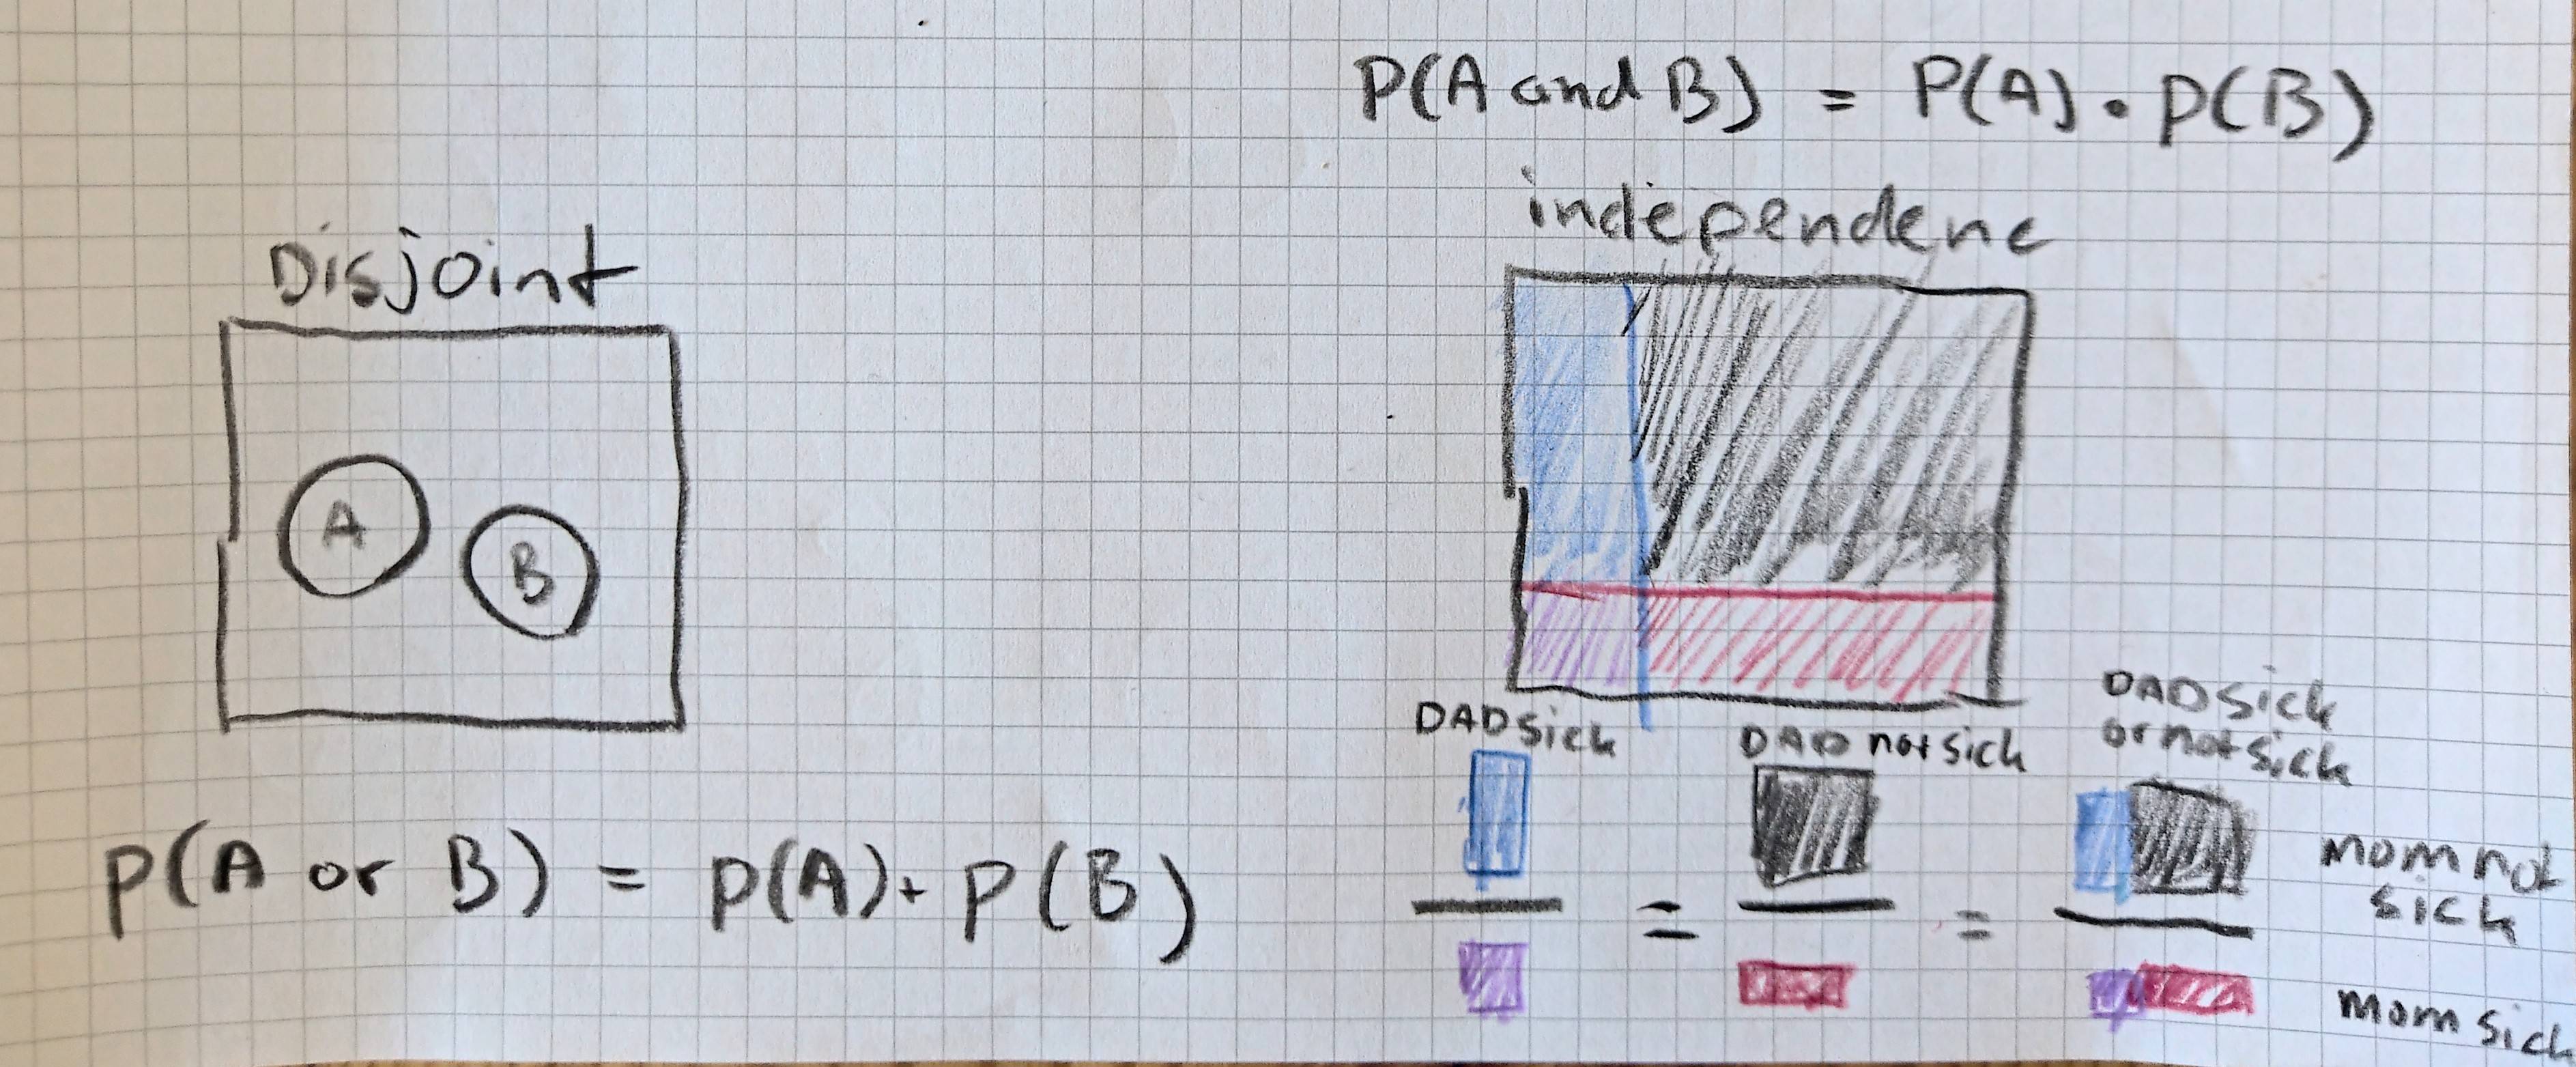
Among with these equations I have the image from this question in my mind Multiply, add, or condition on probability?

explanation sum and product rule

Also this question: If 'B is more likely given A', then 'A is more likely given B' has that image.

$\endgroup$
3
  • $\begingroup$ Are there some typos above where $\bigvee$ should be $\bigwedge$? $\endgroup$
    – Galen
    Commented Aug 2, 2023 at 21:25
  • $\begingroup$ @Galen, that's right I had switched 'and' and 'or'. $\endgroup$ Commented Aug 2, 2023 at 22:27
  • $\begingroup$ FWIIW I like the hand-drawn diagrams. $\endgroup$
    – Galen
    Commented Aug 2, 2023 at 22:37
1
$\begingroup$

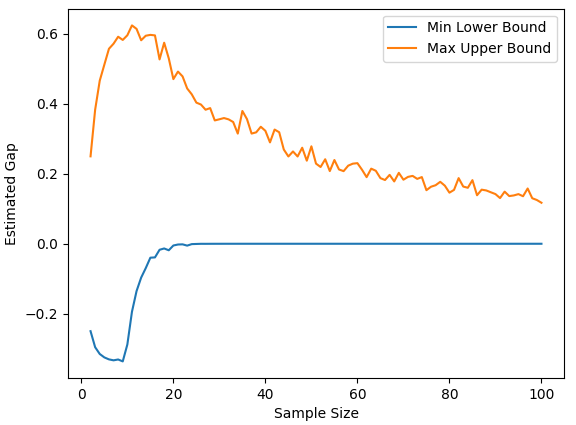
A quick Monte Carlo suggests that the bounds can be wider for $n> 2$.

import numpy as np
np.random.seed(2018)

m = 10**6

L = []
U = []

for n in range(2, 101):
    p = np.random.uniform(size=m*n).reshape(m,n)
    sump = np.sum(p, axis=1)
    prodp = np.prod(p, axis=1)

    lower = np.maximum(sump - (n-1), 0) - prodp
    upper = np.min(p, axis=1) - prodp

    L.append(np.min(lower))
    U.append(np.max(upper))
    print(n)

import matplotlib.pyplot as plt

plt.plot(range(2,101), L, label='Min Lower Bound')
plt.plot(range(2,101), U, label='Max Upper Bound')
plt.xlabel('Sample Size')
plt.ylabel('Estimated Gap')
plt.legend()
plt.show()

The result was:

enter image description here

which indicates that the interval on the independence gap for greater than 2 variables can be wider than that for two.

Somewhere between $n=7$ and $n=9$ the behaviour in my simulation changes. I suspect this likely showing the $m=10^6$ as a sample size becomes insufficient. Essentially we are sampling uniformly from the interior of an unit $n$-cube, which becomes inefficient for larger dimension than about $n=7$.

An exact expression for the bounds as a function of $n$ would still be appreciated.

$\endgroup$
3
  • $\begingroup$ Conjectures: $$\limsup \limits_{n \rightarrow \infty} \phi_{X_1, \ldots, X_n}(x_1, \ldots, x_n) = 1$$ $$\liminf \limits_{n \rightarrow \infty} \phi_{X_1, \ldots, X_n}(x_1, \ldots, x_n) = -1$$ $\endgroup$
    – Galen
    Commented Aug 2, 2023 at 18:42
  • $\begingroup$ For n=3 I noticed that p[np.argmin(lower)], p[np.argmax(upper)] gives (array([0.67840591, 0.65334652, 0.66812344]), array([0.5807617 , 0.58092012, 0.58193792])). It was also the case for $n=2$ that the min/max args were for all the probabilities to be equally $\frac{1}{2}$. It leads me to speculate the optima occur when $p_1 = p_2 = \cdots = p_{n-1} = p_{n-2}$. The min and max may not in general be achieved for the same $p$. So some $p^n$ seems to be important rather than arbitrary probabilities. $\endgroup$
    – Galen
    Commented Aug 2, 2023 at 18:56
  • $\begingroup$ math.stackexchange.com/a/4746610/230586 $\endgroup$
    – Galen
    Commented Aug 5, 2023 at 17:47
1
$\begingroup$

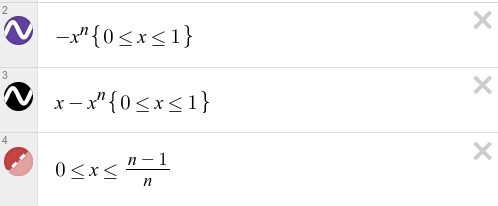
For a given $n$, a naive guess is there are optimal $p$ and $q$ such the bounds of the independence gap are given by:

$$\phi \in \left[-q^n, p-p^n \right]$$

where $q \leq \frac{n-1}{n}$.

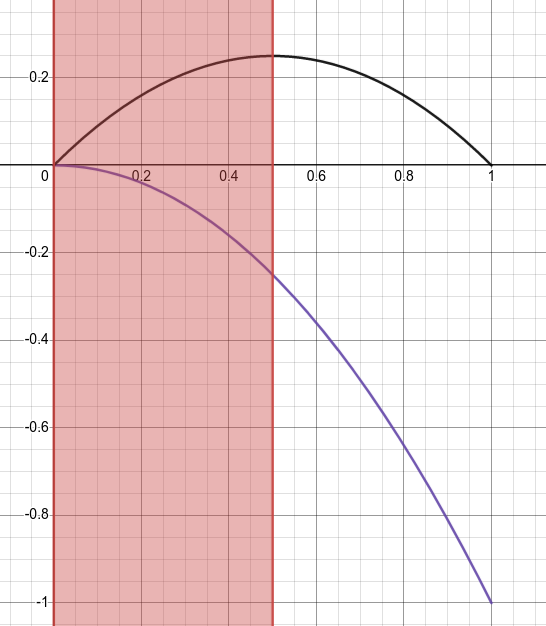
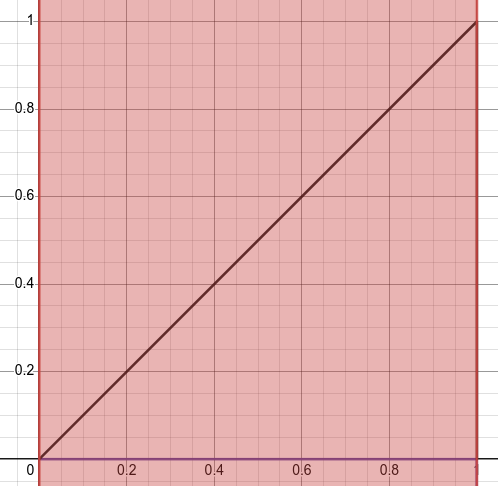
Let's visualize some cases with Desmos. Here I have separate plots for the lower and upper bounds, but don't be confused by the fact that Desmos is using a generic $x$ in both cases.

enter image description here

For n=2 we seem to get that $p=q=\frac{1}{2}$. For $q$ this is read off the graph where the purple curve intersects with the the red region and that the purple curve is at its minimum. As far as I have seen, this can be simplified to where $q = \frac{n-1}{n}$, which for $n=2$ gives $q = \frac{1}{2}$. The value of $p$ is whatever the maximum value of the black curve is.

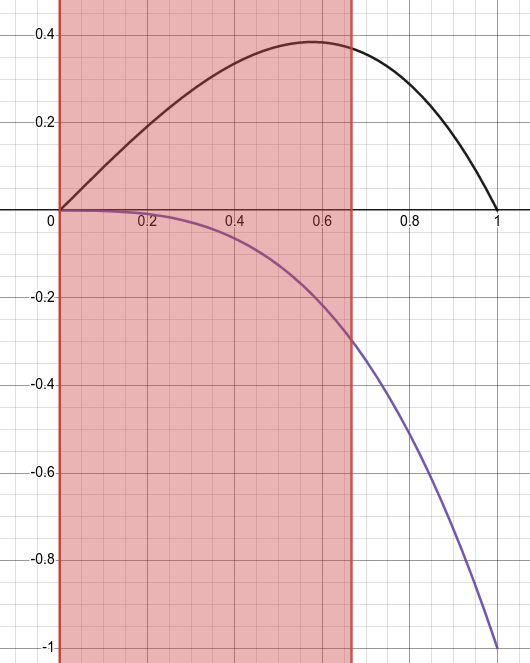
enter image description here

For $n=3$ we get different answers for $p$ and $q$. It appears that $p \approx 0.5775$, whereas $q = \frac{2}{3}$.

enter image description here

Changing the $n$ slider in Desmos gives me an impression that the curves converge to a result as $n$ becomes large:

enter image description here

It also seemed that among the plots that there was always a unique maximum for $p$, and likewise for $q=\frac{n-1}{n}$.For $p-p^n$ the optimal value of $p$ can be specified by its derivative.

$$\frac{\partial}{\partial p} \left[ p-p^n \right] = 1 - n p^{n-1}.$$

Letting $\frac{\partial}{\partial p} \left[ p-p^n \right] = 0$, then

$$1 - n p^{n-1} = 0 \iff \sqrt[n-1]{\frac{1}{n}} = p \iff \frac{1}{\sqrt[n-1]{n}} = p$$

We know by the fundamental theorem of algebra that there could be $n-1$ candidates for $p$, but looking at the plots I think $p \in [0,1]$ will imply a unique real-valued solution.

So my revision of the interval is given by:

$$\phi \in \left[ - \left(1\ -\ \frac{1}{n}\right)^n, \left(1\ -\ \frac{1}{n}\right) n^{\left(\frac{1}{1-n}\right)} \right]$$

Plotting the lower and upper bound we can see that near-absolute-unity independence gaps are not achieved even with 14 variables.

enter image description here

Lastly, we can use these derived bounds to normalize any observed Frechet bounds such that $-1 \leq \phi \leq 1$ as I had originally expected:

$$\phi_{\text{Normalized}} \in \left[ \frac{\max \left(0, \sum_{k=1}^n P(A_k) - (n-1) \right) - \prod_{k=1}^n P(A_k) }{\left( 1 - \frac{1}{n} \right)^n}, \frac{\min_k \{ P(A_k) \} - \prod_{k=1}^n P(A_k)}{\left(1 - \frac{1}{n} \right)n^{\frac{1}{1-n}}} \right]$$

All of these results are provisional on my guess being correct, which it readily may not be.

$\endgroup$
2
  • 1
    $\begingroup$ I believe that these thoughts are correct. I have more or less copied them in my answer, but I thought it was ok by adding the idea of using $$P(A_i) = P(\bigvee_{i=1}^n A_i) + P(A_i \text{ and } \bigwedge_{i=1}^n \lnot A_i)$$ and the limits on the latter term. $\endgroup$ Commented Aug 2, 2023 at 20:57
  • $\begingroup$ math.stackexchange.com/a/4746610/230586 $\endgroup$
    – Galen
    Commented Aug 5, 2023 at 17:47

Your Answer

By clicking “Post Your Answer”, you agree to our terms of service and acknowledge you have read our privacy policy.

Not the answer you're looking for? Browse other questions tagged or ask your own question.