28
$\begingroup$

I have a data set with tens of thousands of observations of medical cost data. This data is highly skewed to the right and has a lot of zeros. It looks like this for two sets of people (in this case two age bands with > 3000 obs each):

     Min.  1st Qu.   Median     Mean  3rd Qu.     Max. 
     0.0      0.0      0.0   4536.0    302.6 395300.0 
    Min.  1st Qu.   Median     Mean  3rd Qu.     Max. 
     0.0      0.0      0.0   4964.0    423.8 721700.0 

If I perform Welch's t-test on this data I get a result back:

Welch Two Sample t-test
    
data:  x and y
t = -0.4777, df = 3366.488, p-value = 0.6329
alternative hypothesis: true difference in means is not equal to 0
95 percent confidence interval:
 -2185.896  1329.358
sample estimates:
mean of x mean of y 
 4536.186  4964.455 

I know its not correct to use a t-test on this data since its so badly non-normal. However, if I use a permutation test for the difference of the means, I get nearly the same p-value all the time (and it gets closer with more iterations).

Using perm package in R and permTS with exact Monte Carlo

    Exact Permutation Test Estimated by Monte Carlo
    
data:  x and y
p-value = 0.6188
alternative hypothesis: true mean x - mean y is not equal to 0
sample estimates:
mean x - mean y 
      -428.2691 
    
p-value estimated from 500 Monte Carlo replications
99 percent confidence interval on p-value:
 0.5117552 0.7277040 

Why is the permutation test statistic coming out so close to the t.test value? If I take logs of the data then I get a t.test p-value of 0.28 and the same from the permutation test. I thought the t-test values wold be more garbage than what I am getting here. This is true of many other data sets I have like this and am wondering why the t-test appears to be working when it shouldn't.

My concern here is that the individual costs are not i.i.d. There are many sub-groups of people with very different cost distributions (women vs men, chronic conditions etc) that seem to violate the iid requirement for central limit theorem, or should I not worry about that?

$\endgroup$
4
  • $\begingroup$ How does it happen that both the minimum value and the median of your data is zero? $\endgroup$ Commented Sep 12, 2013 at 21:42
  • 1
    $\begingroup$ More than half the values are zero, indicating half the people had no medical care that year. $\endgroup$
    – Chris
    Commented Sep 12, 2013 at 22:08
  • $\begingroup$ And why do you think that the permutation test should be different? (if both groups have a similarly non-normal distribution) $\endgroup$
    – FairMiles
    Commented Sep 12, 2013 at 23:06
  • $\begingroup$ Keep in mind that i.i.d. is two separate assumptions. The first is 'independent'. The second is 'identically distributed'. You seem to be suggesting that the observations are not 'identically distributed'. This should not affect the answers provided so far, as we can still assume that all the observations are from one big mixture of distributions. But if you think that the observations are not independent, that is a much different and potentially more difficult issue. $\endgroup$
    – zkurtz
    Commented Sep 13, 2013 at 19:21

3 Answers 3

41
$\begingroup$

Neither the t-test nor the permutation test have much power to identify a difference in means between two such extraordinarily skewed distributions. Thus they both give anodyne p-values indicating no significance at all. The issue is not that they seem to agree; it is that because they have a hard time detecting any difference at all, they simply cannot disagree!


For some intuition, consider what would happen if a change in a single value occurred in one dataset. Suppose that the maximum of 721,700 had not occurred in the second data set, for instance. The mean would have dropped by approximately 721700/3000, which is about 240. Yet the difference in the means is only 4964-4536 = 438, not even twice as big. That suggests (although it does not prove) that any comparison of the means would not find the difference significant.

We can verify, though, that the t-test is not applicable. Let's generate some datasets with the same statistical characteristics as these. To do so I have created mixtures in which

  • $5/8$ of the data are zeros in any case.
  • The remaining data have a lognormal distribution.
  • The parameters of that distribution are arranged to reproduce the observed means and third quartiles.

It turns out in these simulations that the maximum values are not far from the reported maxima, either.

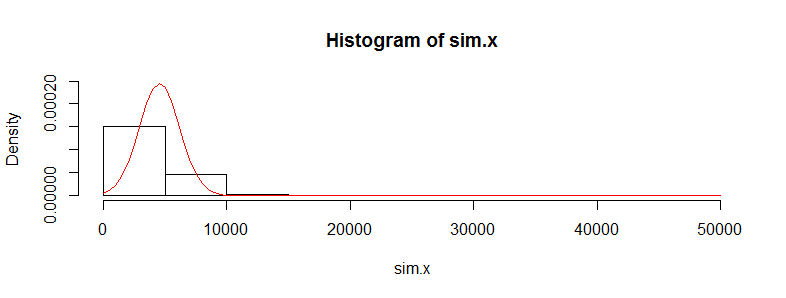
Let's replicate the first dataset 10,000 times and track its mean. (The results will be almost the same when we do this for the second dataset.) The histogram of these means estimates the sampling distribution of the mean. The t-test is valid when this distribution is approximately Normal; the extent to which it deviates from Normality indicates the extent to which the Student t distribution will err. So, for reference, I have also drawn (in red) the PDF of the Normal distribution fit to these results.

Histogram 1

We can't see much detail because there are some whopping big outliers. (That's a manifestation of this sensitivity of the means I mentioned.) There are 123 of them--1.23%--above 10,000. Let's focus on the rest so we can see the detail and because these outliers may result from the assumed lognormality of the distribution, which is not necessarily the case for the original dataset.

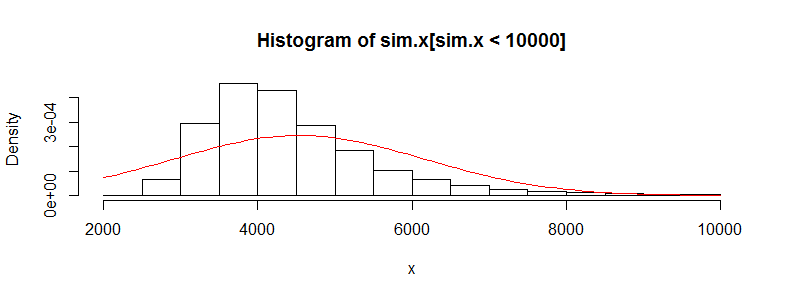
Histogram 2

That is still strongly skewed and deviates visibly from the Normal approximation, providing sufficient explanation for the phenomena recounted in the question. It also gives us a sense of how large a difference in means could be detected by a test: it would have to be around 3000 or more to appear significant. Conversely, the actual difference of 428 might be detected provided you had approximately $(3000/428)^2 = 50$ times as much data (in each group). Given 50 times as much data, I estimate the power to detect this difference at a significance level of 5% would be around 0.4 (which is not good, but at least you would have a chance).


Here is the R code that produced these figures.

#
# Generate positive random values with a median of 0, given Q3,
# and given mean. Make a proportion 1-e of them true zeros.
#
rskew <- function(n, x.mean, x.q3, e=3/8) {
  beta <- qnorm(1 - (1/4)/e)
  gamma <- 2*(log(x.q3) - log(x.mean/e))
  sigma <- sqrt(beta^2 - gamma) + beta
  mu <- log(x.mean/e) - sigma^2/2
  m <- floor(n * e)
  c(exp(rnorm(m, mu, sigma)), rep(0, n-m))
}
#
# See how closely the summary statistics are reproduced.
# (The quartiles will be close; the maxima not too far off;
# the means may differ a lot, though.)
#
set.seed(23)
x <- rskew(3300, 4536, 302.6)
y <- rskew(3400, 4964, 423.8)
summary(x)
summary(y)
#
# Estimate the sampling distribution of the mean.
#
set.seed(17)
sim.x <- replicate(10^4, mean(rskew(3367, 4536, 302.6)))
hist(sim.x, freq=FALSE, ylim=c(0, dnorm(0, sd=sd(sim.x))))
curve(dnorm(x, mean(sim.x), sd(sim.x)), add=TRUE, col="Red")
hist(sim.x[sim.x < 10000], xlab="x", freq=FALSE)
curve(dnorm(x, mean(sim.x), sd(sim.x)), add=TRUE, col="Red")
#
# Can a t-test detect a difference with more data?
#
set.seed(23)
n.factor <- 50
z <- replicate(10^3, {
  x <- rskew(3300*n.factor, 4536, 302.6)
  y <- rskew(3400*n.factor, 4964, 423.8)
  t.test(x,y)$p.value
})
hist(z)
mean(z < .05) # The estimated power at a 5% significance level
$\endgroup$
6
  • 2
    $\begingroup$ For an example of a highly skewed dataset where the t-test nevertheless is applicable (because of the large amount of data), please see stats.stackexchange.com/questions/110418/…. These two cases together show there is no cut-and-dried answer to the question: you have to consider both the distribution of the data and the amount of data when deciding whether the t-test will be meaningful and accurate. $\endgroup$
    – whuber
    Commented Aug 9, 2014 at 18:39
  • 5
    $\begingroup$ I've favourited this question in the hopes of being able to find it again when faced with people who think that n=30 or n=300 is enough to just go ahead and assume sample means are normally distributed (and so forth). I have good simulated examples but it's nice to show this is an issue with real data as well. $\endgroup$
    – Glen_b
    Commented Nov 18, 2015 at 23:43
  • 1
    $\begingroup$ +1, but I wonder what your practical recommendation would be in a situation like that. Should one try to use a permutation test based on some other statistic instead of the mean (perhaps some high quantile)? Should one try to apply some transformation before running standard tests on the means? Or should one rather give up any hope of detecting a significant difference between two samples? $\endgroup$
    – amoeba
    Commented Nov 30, 2015 at 21:39
  • $\begingroup$ @amoeba If the concern is to test differences in means, then the permutation test will be of no help: you're not going to a find a significant difference here. If you test some other statistic, then you're not testing the mean (which is particularly relevant for cost data!), so whether that can be recommended depends on the objectives. $\endgroup$
    – whuber
    Commented Nov 30, 2015 at 23:39
  • $\begingroup$ In a pinch maybe best to go with nonparametric tests (signed-rank or rank-sum) rather than Student's-t? $\endgroup$
    – RobertF
    Commented Aug 31, 2023 at 15:49
5
$\begingroup$

When n is large (like 300, even far less than 3000), the t-test is essentially the same as the z-test. That is, the t-test becomes nothing more than an application of the central limit theorem, which says that the MEAN for each of your two groups is almost exactly normally distributed (even if the observations underlying the two means are very far from being normally distributed!). This is also the reason that your typical t-table does not bother to show values for n greater than 1000 (for example, this t-table). Thus, I am not surprised to see that you are getting such well-behaved results.

Edit: I seem to have underestimated the extremity of the skewness and its importance. While my point above has merit in less extreme circumstances, whuber's answer to the question is much better overall.

$\endgroup$
3
  • 4
    $\begingroup$ When skewness is extreme--as the quoted statistics attest--we have no assurance that the sampling distribution of the mean of 300 or even 3000 samples will be anywhere near Normal. That is why the OP is surprised. You counter that by saying you are not surprised, but that appears to come down to one person's intuition compared to another's. What objective argument can you supply for these data demonstrating that 300 (or 3000) is a large enough sample for the t-test to work well? $\endgroup$
    – whuber
    Commented Sep 13, 2013 at 15:34
  • $\begingroup$ Great point. I admit, if the data is sufficiently skewed, my argument fails. So the question to me is, exactly how skewed is the data, and is there a formal result out there relating the skewness to the required sample size. $\endgroup$
    – zkurtz
    Commented Sep 13, 2013 at 16:36
  • 1
    $\begingroup$ I have posted an answer to that question. We know (at least approximately) how skewed the data are based on the summary statistics in the question. That skew is so strong that neither 300, nor 3000, nor even 30,000 observations per group will make the sampling distribution of the mean "almost exactly normal." You probably need around 300,000 or so before that claim becomes plausible. Thus we must seek a different explanation for why the two tests agree. Mine is that neither is "well-behaved" rather than that both are well-behaved. $\endgroup$
    – whuber
    Commented Sep 13, 2013 at 16:51
2
$\begingroup$

I know this answer is way late. However, I am getting a PhD in health services research, so I work with healthcare data a lot, including cost data.

I don't know what data the OP had. If it were cross-sectional data, then chances are it was justifiably IID. Independence means that each unit, so each person, is independent. That is very likely justifiable. As to identically distributed, the data can be modeled as all coming from, say, a gamma distribution in a generalized linear model with a log link. This is what people commonly do in practice. Or if you want to get fancy, there are probably hurdle models (popular in econometrics) that deal with the excess 0s. Which, by the way, are pretty common in healthcare spending. The OP is technically correct that the data aren't necessarily identically distributed, e.g. the mean and variance will shift with age, but it's a workable assumption in multiple regression models.

If each person was in the dataset for more than one year, then the data wouldn't be IID. There are more complex models available for that. A relatively simple one of those would probably be generalized estimating equations, gamma distribution and log link again, assume an exchangeable working correlation. Or, if these data are from publicly available survey data, there is NOT an equal probability of being sampled - many of those surveys interview multiple people in each household, and they also stratify the population and oversample some groups (e.g. racial minorities). The user would have to correct for that.

I don't use t-tests, especially not for observational data. There are too many confounders, so you would want to adjust for them in a (generalized) linear model. So, I can't comment on the questions related specifically to t-tests.

$\endgroup$

Your Answer

By clicking “Post Your Answer”, you agree to our terms of service and acknowledge you have read our privacy policy.

Not the answer you're looking for? Browse other questions tagged or ask your own question.