12
$\begingroup$

Jerome Cornfield has written:

One of the finest fruits of the Fisherian revolution was the idea of randomization, and statisticians who agree on few other things have at least agreed on this. But despite this agreement and despite the widespread use of randomized allocation procedures in clinical and in other forms of experimentation, its logical status, i.e., the exact function it performs, is still obscure.

Cornfield, Jerome (1976). "Recent Methodological Contributions to Clinical Trials". American Journal of Epidemiology 104 (4): 408–421.

Throughout this site and in a variety of literature I consistently see confident claims about the powers of randomization. Strong terminology such as "it eliminates the issue of confounding variables" are common. See here, for example. However, many times experiments are run with small samples (3-10 samples per group) for practical/ethical reasons. This is very common in preclinical research using animals and cell cultures and the researchers commonly report p values in support of their conclusions.

This got me wondering, how good is randomization at balancing confounds. For this plot I modeled a situation comparing treatment and control groups with one confound that could take on two values with 50/50 chance (eg type1/type2, male/female). It shows the distribution of "% Unbalanced" (Difference in # of type1 between treatment and control samples divided by sample size) for studies of a variety of small sample sizes. The red lines and right side axes show the ecdf.

Probability of various degrees of balance under randomization for small sample sizes: enter image description here

Two things are clear from this plot (unless I messed up somewhere).

1) The probability of getting exactly balanced samples decreases as sample size is increased.

2) The probability of getting a very unbalanced sample decreases as sample size increases.

3) In the case of n=3 for both groups, there is a 3% chance of getting a completely unbalanced set of groups (all type1 in the control, all type2 in the treatment). N=3 is common for molecular biology experiments (eg measure mRNA with PCR, or proteins with western blot)

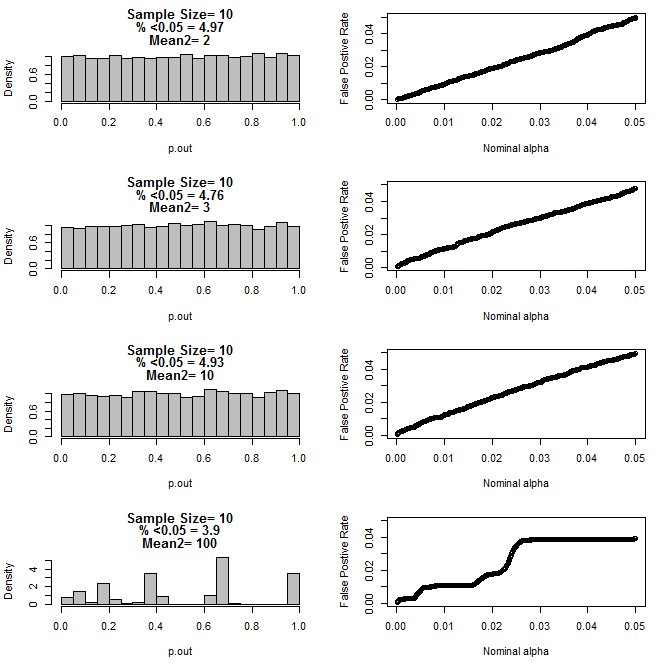
When I examined the n=3 case further, I observed strange behaviour of the p values under these conditions. The left side shows the overall distribution of pvalues calculating using t-tests under conditions of different means for the type2 subgroup. The mean for type1 was 0, and sd=1 for both groups. The right panels show the corresponding false positive rates for nominal "significance cutoffs" from .05 to.0001.

Distribution of p-values for n=3 with two subgroups and different means of the second subgroup when compared via t test (10000 monte carlo runs): enter image description here

Here are the results for n=4 for both groups: enter image description here

For n=5 for both groups: enter image description here

For n=10 for both groups: enter image description here

As can be seen from the charts above there appears to be an interaction between sample size and difference between subgroups that results in a variety of p-value distributions under the null hypothesis that are not uniform.

So can we conclude that p-values are not reliable for properly randomized and controlled experiments with small sample size?

R code for first plot

require(gtools)

#pdf("sim.pdf")
par(mfrow=c(4,2))
for(n in c(3,4,5,6,7,8,9,10)){
  #n<-3
  p<-permutations(2, n, repeats.allowed=T)

  #a<-p[-which(duplicated(rowSums(p))==T),]
  #b<-p[-which(duplicated(rowSums(p))==T),]

  a<-p
  b<-p

  cnts=matrix(nrow=nrow(a))
  for(i in 1:nrow(a)){
    cnts[i]<-length(which(a[i,]==1))
  }


  d=matrix(nrow=nrow(cnts)^2)
  c<-1
  for(j in 1:nrow(cnts)){
    for(i in 1:nrow(cnts)){
      d[c]<-cnts[j]-cnts[i]
      c<-c+1
    }
  }
  d<-100*abs(d)/n

  perc<-round(100*length(which(d<=50))/length(d),2)

  hist(d, freq=F, col="Grey", breaks=seq(0,100,by=1), xlab="% Unbalanced",
       ylim=c(0,.4), main=c(paste("n=",n))
  )
  axis(side=4, at=seq(0,.4,by=.4*.25),labels=seq(0,1,,by=.25), pos=101)
  segments(0,seq(0,.4,by=.1),100,seq(0,.4,by=.1))
  lines(seq(1,100,by=1),.4*cumsum(hist(d, plot=F, breaks=seq(0,100,by=1))$density),
        col="Red", lwd=2)

}

R code for plots 2-5

for(samp.size in c(6,8,10,20)){
  dev.new()
  par(mfrow=c(4,2))
  for(mean2 in c(2,3,10,100)){
    p.out=matrix(nrow=10000)

    for(i in 1:10000){

      d=NULL
      #samp.size<-20
      for(n in 1:samp.size){
        s<-rbinom(1,1,.5)
        if(s==1){
          d<-rbind(d,rnorm(1,0,1))
        }else{
          d<-rbind(d,rnorm(1,mean2,1))
        }
      }

      p<-t.test(d[1:(samp.size/2)],d[(1+ samp.size/2):samp.size], var.equal=T)$p.value

      p.out[i]<-p
    }


    hist(p.out, main=c(paste("Sample Size=",samp.size/2),
                       paste( "% <0.05 =", round(100*length(which(p.out<0.05))/length(p.out),2)),
                       paste("Mean2=",mean2)
    ), breaks=seq(0,1,by=.05), col="Grey", freq=F
    )

    out=NULL
    alpha<-.05
    while(alpha >.0001){

      out<-rbind(out,cbind(alpha,length(which(p.out<alpha))/length(p.out)))
      alpha<-alpha-.0001
    }

    par(mar=c(5.1,4.1,1.1,2.1))
    plot(out, ylim=c(0,max(.05,out[,2])),
         xlab="Nominal alpha", ylab="False Postive Rate"
    )
    par(mar=c(5.1,4.1,4.1,2.1))
  }

}
#dev.off()
$\endgroup$
2
  • $\begingroup$ I found your description of the conditions and problem a little difficult to understand at first. Type I and type II are technical terms that are different to your usage of type1 subgroup and type2 subgroup. As far as I can tell you are applying a t-test to data from a distribution with a mixture of means. Is that right? $\endgroup$ Commented Nov 2, 2013 at 0:25
  • $\begingroup$ Yes, a mixture of two normal distributions. "type1" refers to N(0,1), type2 is N(mean2,1). Where mean2 = (2,3,10, or 100). Sorry I could change it to typeA, typeB if you think that would help? $\endgroup$
    – Flask
    Commented Nov 2, 2013 at 0:27

2 Answers 2

5
$\begingroup$

You are correct to point out the limitations of randomisation in dealing with unknown confounding variables for very small samples. However, the problem is not that the P-values are not reliable, but that their meaning varies with sample size and with the relationship between the assumptions of the method and the actual properties of the populations.

My take on your results is that the P-values performed quite well until the difference in the subgroup means was so large that any sensible experimenter would know that there was an issue prior to doing the experiment.

The idea that an experiment can be done and analysed without reference to a proper understanding of the nature of the data is mistaken. Before analysing a small dataset you must know enough about the data to be able to confidently defend the assumptions implicit in the analysis. Such knowledge commonly comes from prior studies using the same or similar system, studies that can be formal published works or informal 'preliminary' experiments.

$\endgroup$
3
  • $\begingroup$ I agree with all you have said, however t-tests are often performed "ritualistically" as Gerd Gigerenzer would put it. In practice the people performing these tests do not have the time/inclination to understand the nuances of what they are doing. For that reason I think the "unreliable" adjective may be apt. I know researchers who when you ask about the distribution (was there one high one, or what caused that big error bar?) have never looked at it. $\endgroup$
    – Flask
    Commented Nov 2, 2013 at 0:40
  • 1
    $\begingroup$ Well, what P-values really 'mean' is rather different from what most people assume. Even the many papers that criticise P-values as being 'irreconcilable with evidence' and the like are mistaken. I uploaded a paper onto arXiv yesterday that explores the properties of P-values and shows how they relate to the type of evidence that experimenters can use. Its title is 'To P or not to P: on the evidential nature of P-values and their place in scientific inference' and its arXiv submission number is 826269. It should be available from Monday. $\endgroup$ Commented Nov 2, 2013 at 7:20
  • $\begingroup$ Could you take a look a this question which has gotten no love for whatever reason?. I agree that p values are something and your paper may help elucidate that, but as a researcher I have to make clear that the boots on the ground pov is that they have failed us. Either due to misuse or innate inappropriateness, this is unclear. I have been asking a series of questions here trying to get the statisticians point of view on it. $\endgroup$
    – Flask
    Commented Nov 2, 2013 at 7:37
3
$\begingroup$

In ecological research, nonrandom assignment of treatments to experimental units (subjects) is standard practice when sample sizes are small and there is evidence of one or more confounding variables. This nonrandom assignment "intersperses" the subjects across the spectrum of possibly confounding variables, which is exactly what random assignment is supposed to do. But at small sample sizes, randomization is more likely to perform poorly at this (as demonstrated above) and therefore it can be a bad idea to rely on it.

Because randomization is advocated so strongly in most fields (and rightfully so), it is easy to forget that the end goal is to reduce bias rather than to adhere to strict randomization. However, it is incumbent upon the researcher(s) to characterize the suite of confounding variables effectively and to carry out the nonrandom assignment in a defensible way that is blind to experimental outcomes and makes use of all available information and context.

For a summary, see pp. 192-198 in Hurlbert, Stuart H. 1984. Pseudoreplication and the design of field experiments. Ecological Monographs 54(2) pp.187-211.

$\endgroup$
7
  • $\begingroup$ I enjoyed reading this, but am concerned that your use of "bias" in the penultimate paragraph might be misread because that term has a specific statistical meaning which would render your statement incorrect. Aren't you rather trying to say that randomization is intended to prevent confounding (a form of "bias" in a colloquial sense) rather than reduce bias (as a measure of inaccuracy of an estimator)? $\endgroup$
    – whuber
    Commented Jan 3, 2014 at 19:53
  • $\begingroup$ I am referring to bias in a statistical sense. In statistics, “bias” is the difference between a statistic and the parameter it estimates. As you mention, the bias of an estimator is the difference between the estimator’s expected value and the true value of the parameter it is estimating. In my post, by “bias” I was referring to the difference between statistics calculated from the data and the parameters that they estimate—for example, between the sample mean (x bar) and the true mean (mu). $\endgroup$ Commented Jan 4, 2014 at 22:38
  • $\begingroup$ As far as I am aware, randomized sampling is not used to reduce bias, nor in many circumstances can it validly be claimed that it does reduce bias. $\endgroup$
    – whuber
    Commented Jan 4, 2014 at 22:49
  • 1
    $\begingroup$ You are mistaken. The primary goal of randomization is to simulate the effect of independence. It does this by eliminating biases that arise through systematic assignment of treatments to subjects. These biases produce inaccurate estimates—most importantly, biased variance estimates—and loss of control over Types I and II error. Even confounding variables (which really amount to a lack of independence) are simply a case of omitted variable bias. But you need not take my word for this … If you are unconvinced by the Hurlburt paper above, here are some other resources to consult: $\endgroup$ Commented Jan 5, 2014 at 21:04
  • 1
    $\begingroup$ Cochran, W. G. and G. M. Cox. 1957. Experimental Designs. New York: Wiley. Federer, W. T. 1955. Experimental Design. New York: Macmillan. Hinkelmann, K., and Kempthorne, O. 1994. Design and Analysis of Experiments. Wiley: New York. Kuehl, R. O. 2000. Design of Experiments: Statistical Principles of research design and analysis. Belmont, CA: Brooks/Cole. $\endgroup$ Commented Jan 5, 2014 at 21:04

Your Answer

By clicking “Post Your Answer”, you agree to our terms of service and acknowledge you have read our privacy policy.

Not the answer you're looking for? Browse other questions tagged or ask your own question.