1
$\begingroup$

I have a dataset with the factor region (4 levels) and a binary variable outcome (0/1). Here in wide format.

 North East South West
     0    1     1    1
     0    0     0    0
     0    1     1    1
     0    0     1    0
     1    0     0    1
     0    1     0    1
     ...

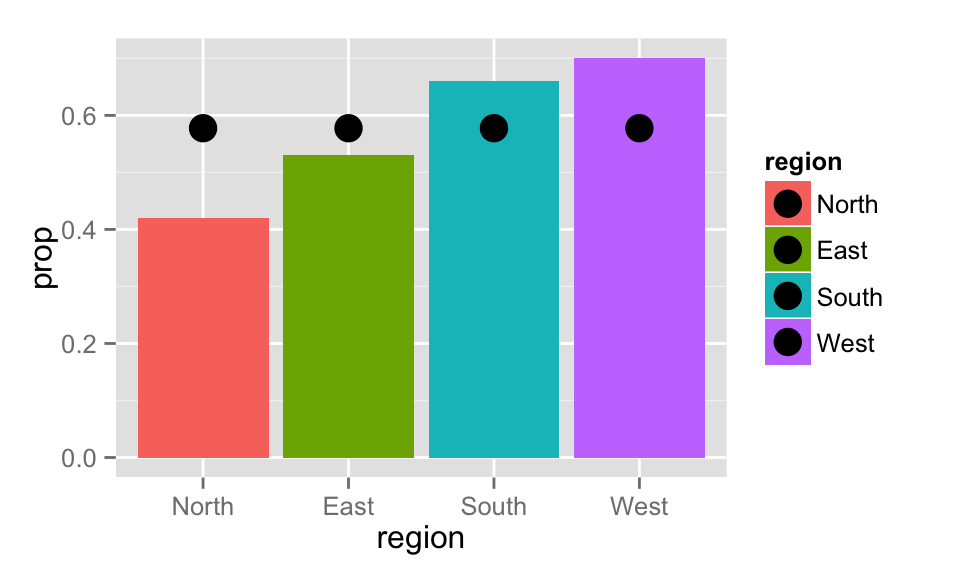
The question I want to answer is: Does the proportion of occurence for each region statistically differ from the mean proportion across all regions? The mean is indicated by the dot in the figure below.

enter image description here

If the outcome was numeric, I might use a GLM approach and e.g. get t-tests (or similar tests) for each dummy variable for the regions against the grand mean. I want the same, but for proportions (i.e. binary outcomes). Note that, I explicitly want to test against the overall mean proportion across all levels of region, not use a pairwise approach. How can I do this?

Idea: Take the (weighted) mean of the estimated proportions and compare each region against the mean using a proportion test (maybe using alpha correction)? Is that approach statistically sound?

Are there "standard" approaches to this problem?

$\endgroup$
3
  • $\begingroup$ Is there any reason you couldn't do a chi-squared test? You would have a 4x2 matrix (each row is a region, the columns are the counts for outcome 0 and outcome 1). The expected value in each cell is calculated as $E_{ij} = n_i \frac{X_j}{N}$ where $n_i$ is the population size of region $i$, $X_j$ is total number with outcome $j$ and $N$ is total population size. Degrees of freedom = 3 (I think). The main reason I can imagine is if the outcomes in each row are dependent? $\endgroup$
    – tristan
    Commented Nov 9, 2015 at 11:51
  • $\begingroup$ @tristan The Chi-sqaure test is an overall test performed on a contingency table. It will not tell me which groups differ from the mean propability. I need four p-Values, not one. $\endgroup$ Commented Nov 9, 2015 at 13:06
  • $\begingroup$ OK, in that case you would probably do a two-tailed exact binomial proportion test. In R you have binom.test which can perform this. I would also adjust the significance level for multiple testing (from 0.05 to 0.0125). I think this is what you are saying in your "Idea", and I think it would be sound. $\endgroup$
    – tristan
    Commented Nov 9, 2015 at 13:44

1 Answer 1

0
$\begingroup$

You have a 4x2-contingency table, and can use a chi-squared test. But you say you want a test for each individual proportion. So use that an extension of the chi-squared test is binary logistic regression. To get a test directly for each of the four proportions omit the intercept from the model, so, using R notation, a model like

mod0 <- glm( cbind(yes,no) ~ region + 0, data=your_data,
             family=binomial) 
summary(mod0)

will give you four p-values.

$\endgroup$

Your Answer

By clicking “Post Your Answer”, you agree to our terms of service and acknowledge you have read our privacy policy.

Not the answer you're looking for? Browse other questions tagged or ask your own question.