5
$\begingroup$

Looking at this post I started to wonder about the gestalt interpretation of the QQ plots generated by qqnorm in R. Here's the plot to avoid having to go to the linked post:
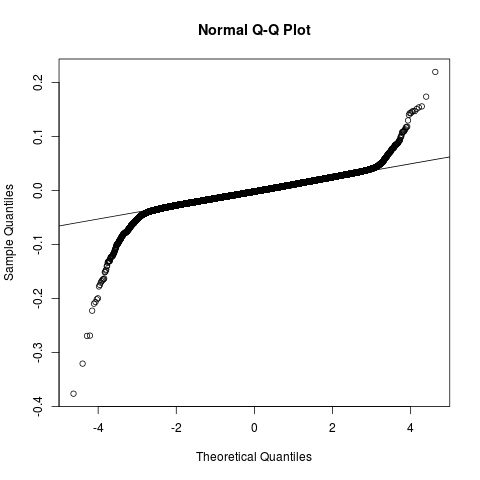
First off, the $y$ axis reads "quantiles", but these are not quantiles, but rather equally spaced values containing very few data points towards the ends. The plot also struck me as too horizontal to be interpreted in a gestalt fashion as a "heavy-tail" distribution.

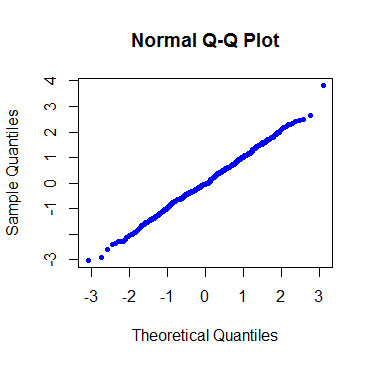
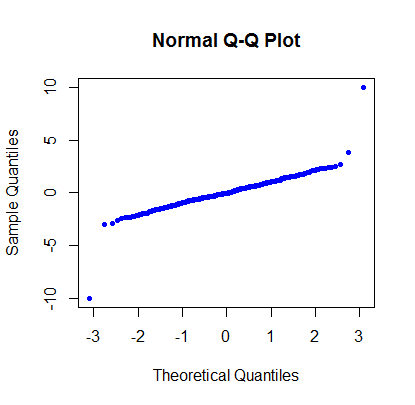
So I ran a quick "convincing-myself" test with R: To a $\small 500$ sample from a standard normal distribution, I added just a couple of asymptotic values $\small -10$ and $\small 10$. Just $\small 2$ data points: x <- c(rnorm(500),-10, 10). My thinking was that these two values couldn't possibly change our opinion - clearly the bulk of the data were normal by design. This was the obvious plot before introducing the -10, 10:

enter image description here

Two loose, possibly mistaken, values wouldn't make a dent. However, the plot was again "heavy-tailed" (not so unexpected now, given the observation on the $y$ axis construction):

enter image description here

... a ridiculously caricatured version of the first plot. My thought was that this could represent a well-known anomaly in some cases, warranting correcting. Surely statisticians must be in the habit of getting rid of these outliers... The most surprising part came when a Shapiro-Wilk test also seemed to comfortably rule out normality just because of these two values:

    Shapiro-Wilk normality test

data:  x
W = 0.8779, p-value < 2.2e-16

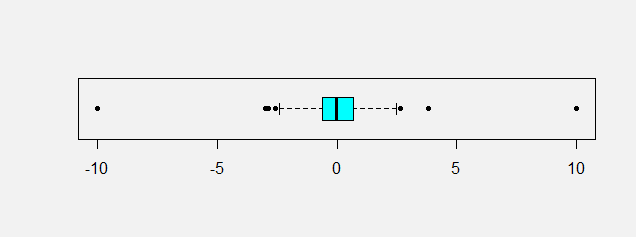
I guess this is consistent with the interpretation of the boxplot:

enter image description here

"If the box plot for the given data has outliers on both sides and has tails longer than the length of the box, then the data is said to have heavy-tailed distribution." An Insight Into Heavy-Tailed Distribution. Annapurna Ravi, Journal of Mathematical Sciences & Mathematics Education, Vol.5, No.1.

The question/-s:

Are these essentially normal data no longer consistent with a normal distribution simply because of $2$ outliers? Can the new data be considered "heavy-tailed" because of these two dots sticking out at either end of the otherwise flat and straight QQ plot? And is this consistent with the mathematical definition of heavy tails?

$\endgroup$
12
  • 2
    $\begingroup$ The values on the y axis are quantiles -- sample quantiles of whatever variate the OP of the other post supplied to the function. $\endgroup$
    – Glen_b
    Commented Nov 26, 2015 at 9:44
  • 5
    $\begingroup$ Why are you calling those more extreme points "asymptotic values"? What's asymptoting to what? $\endgroup$
    – Glen_b
    Commented Nov 26, 2015 at 9:52
  • 2
    $\begingroup$ @AntoniParellada: If you wanted to estimate the cut-points dividing the distribution that generated your data into 503 equal parts then you could use the observed values themselves & call them quantiles. $\endgroup$
    – Scortchi
    Commented Nov 26, 2015 at 12:32
  • 3
    $\begingroup$ Following comments by @Scortchi: in many fields people talk about plotting positions. One introductory explanation is at stata.com/support/faqs/statistics/… See section 3 and hum along with any Stata content. References are given. $\endgroup$
    – Nick Cox
    Commented Nov 26, 2015 at 13:34
  • 3
    $\begingroup$ @Antoni Note that in the QQ plots post of mine the term "heavy tailed" was referring not to the sample but to the distribution from which the sample was drawn (and is consistent with the definition of heavy-tailed you gave in comments above). It's intended to convey that if you take a particular heavy tailed distribution, the QQ plot looks like that ('on average' in the plot in the first set, with some examples in the subsequent plots). I'll need to make some small changes to my answer in light of the comments here. $\endgroup$
    – Glen_b
    Commented Nov 26, 2015 at 18:02

3 Answers 3

8
$\begingroup$

The first plot looks to me quite similar to a mixture of a normal (most of the points) and something with larger variance and somewhat heavier tail (perhaps a 90-10 mixture but it's hard to judge) -- and possibly a slightly lower center. Of course, that doesn't mean the original process is physically a mixture of two original processes; you can get exactly the same appearance with something that has a distribution close to the distribution function of that mixture.

Surely statisticians must be in the habit of getting rid of these outliers

Actually, there are many dozens of questions (possibly hundreds) here where people who aren't statisticians are asking about trying to get rid of outliers. You don't quite so often see the statisticians who respond saying "get rid of outliers"; you may want to do something* but not necessarily "get rid of them".

* (such as choose a better model, or a more robust methodology; if I was using a Wilcoxon-Mann-Whitney test on a pair of samples like that I might not care at all),

The most surprising part came when a Shapiro-Wilk test also seemed to comfortably rule out normality just because of these two values:

That wasn't remotely surprising to me, since they will dramatically affect the correlation in the plot, which directly impacts the closely-related Shapiro-Francia statistic (if my recollection is correct, you can regard it as a function of $R^2$ in the QQ-plot -- or possibly it is $R^2$, and it's also typically very close to the Shapiro-Wilk). So in fact I'd be surprised if two such large outliers didn't cause the Shapiro-Wilk to be significant given how big the sample is.

In fact I was playing with much larger samples just recently (yesterday? I think it was) with only a single outlier where the squared-correlation in the corresponding plot was really quite close to 0.

then the data is said to have heavy-tailed distribution

Said by whom? Presumably the author of that sentence. (He either needs to say who is saying it, or own it as his own definition.)

It seems a somewhat odd definition, but okay, he can define it that way if he wants.

(By the look of it, that journal badly needs a decent editor)

Are these essentially normal data no longer consistent with a normal distribution simply because of 2 outliers?

A contaminated distribution where a large fraction of the distribution (leading to 99.6% of the values in the sample) are from a standard normal and a very small fraction of the distribution (leading to 0.4% of the sample values) are from some distribution likely to produce values 10 sd's (10 of the uncontaminated distributions sd's) away from the mean is - clearly - not normal; we just said words to that effect.

You may well ask how much impact does it have on whatever thing you're interested in. For some things the impact may be great for other things it may be small, but normal populations have almost no chance of producing a sample like that.

Can the new data be considered "heavy-tailed" because of these two dots sticking out at either end of the otherwise flat and straight QQ plot?

A distribution that is likely to produce a sample like that would be called heavy tailed. We might also reasonably refer to the ecdf of that sample as 'heavy tailed'.

And is this consistent with the mathematical definition of heavy tails?

Which definition are we talking about?

Note that the ecdf doesn't have any values at all beyond the largest and smallest sample values; if you have a definition of heavy tailed that talks about limiting behavior of the tail of (say) the survivor function (on the right, and perhaps the cdf on the left), it might not be heavy tailed at all ... but the distribution from which the sample was drawn might -- or might not -- be heavy tailed by the same definition, depending on what the actual distribution was and what the definition of heavy-tailed was.

If by mathematical you mean the definition here:

https://en.wikipedia.org/wiki/Heavy-tailed_distribution#Definition_of_heavy-tailed_distribution

(adjusted to be suitable for both tails being heavy, mutatis mutandis), then such a distribution can certainly produce outliers of a roughly similar sort to the ones in your display, or potentially considerably more extreme.

You can see outliers like those with less-heavy-than-exponential tails, though. A simple scale mixture of two normals might suffice, for example

$\endgroup$
5
  • $\begingroup$ re: math definition I was going by the Wikipedia entry: The distribution of a random variable X with distribution function F is said to have a heavy right tail if: $\lim_{x \to \infty} e^{\lambda x}\Pr[X>x] = \infty$ for all $\lambda>0$. which I couldn't track down or explain to myself, but it looks like the result of some sort of transform? $\endgroup$ Commented Nov 26, 2015 at 12:27
  • $\begingroup$ As for the "heavy-tailed" labels (in my post; I don't know if when you are referring to a journal you suspect it's the material from the linked post that comes from a scientific journal) are simply a sort of reading of the shape of the plot. Frankly I was looking at one of your many outstanding posts: here $\endgroup$ Commented Nov 26, 2015 at 12:32
  • 2
    $\begingroup$ You don't quite so often see the statisticians who respond saying "get rid of outliers" Agreed, and you'll be happy to affirm that non-statisticians can often give the same advice as statisticians. $\endgroup$
    – Nick Cox
    Commented Nov 26, 2015 at 15:30
  • $\begingroup$ @Nick Certainly. I just wanted to dispel the perception that there was any sort of statistical dogma about removal of outliers, as much as there seems to be a fairly widespread perception that there is. [Some statisticians will say "remove outliers" in some circumstances, but that's not at all the same thing] $\endgroup$
    – Glen_b
    Commented Nov 26, 2015 at 17:58
  • 1
    $\begingroup$ Sometimes outliers are produced because the methodology for processing the data is flawed yielding results that are sporadically nonphysical. In those cases one has not only outliers but a physical reason to eliminate them. It is then tempting to use non-parametric methods, as mentioned above, instead of parametric ones, but non-parametric regression may confuse the reader more than trimming the data, and most people have not heard of non-parametric regression like Theil regression. $\endgroup$
    – Carl
    Commented Jun 4, 2016 at 2:46
3
$\begingroup$

Are these essentially normal data no longer consistent with a normal distribution simply because of 2 outliers?

The plot clearly shows two extreme outliers, & that's reason enough to doubt that the data-generating process is well modelled by a normal distribution. Tests specifically designed for outlier detection may have more power to detect them than general-purpose normality tests, but that's not to say the latter won't or shouldn't.

Surely statisticians must be in the habit of getting rid of these outliers

It depends. If you want to model the data-generating process in a strict sense then you wouldn't. (If no brand-name distribution seems appropriate, you might use the empirical distribution function, perhaps smoothed.) Often you want to model a slightly idealized version in which people don't write decimal points in the wrong place or use dirty test-tubes. Sometimes you might want to model just those data that fit a model you like, which can be rather more contentious. See Rigorous definition of an outlier?, Can data cleaning worsen the results of statistical analysis?, Removing outliers from data - maximum number of outliers that you can remove? & the tag. And if you're not really interested in the whole distribution for its own sake you could use procedures robust to the presence of outliers to answer the questions you do care about.

Can the new data be considered "heavy-tailed" because of these two dots sticking out at either end of the otherwise flat and straight QQ plot? And is this consistent with the mathematical definition of heavy tails?
I daresay you could find heavy-tailed, fat-tailed, long-tailed and/or leptokurtic distributions with which the data are consistent. See Example of heavy-tailed distribution that is not long-tailed.

$\endgroup$
2
  • 2
    $\begingroup$ +1. I'd assert that the more statistics you know, the more likely you are to want to include outliers in an analysis in a way that makes sense of them. Values known certainly to be wrong don't belong in an analysis, that's clear; but values seeming to be awkward to handle often just need to be thought of differently. $\endgroup$
    – Nick Cox
    Commented Nov 26, 2015 at 12:18
  • $\begingroup$ Thank you. It helped understand the issue. I'll go over the hyperlinked posts. $\endgroup$ Commented Nov 26, 2015 at 12:39
1
$\begingroup$

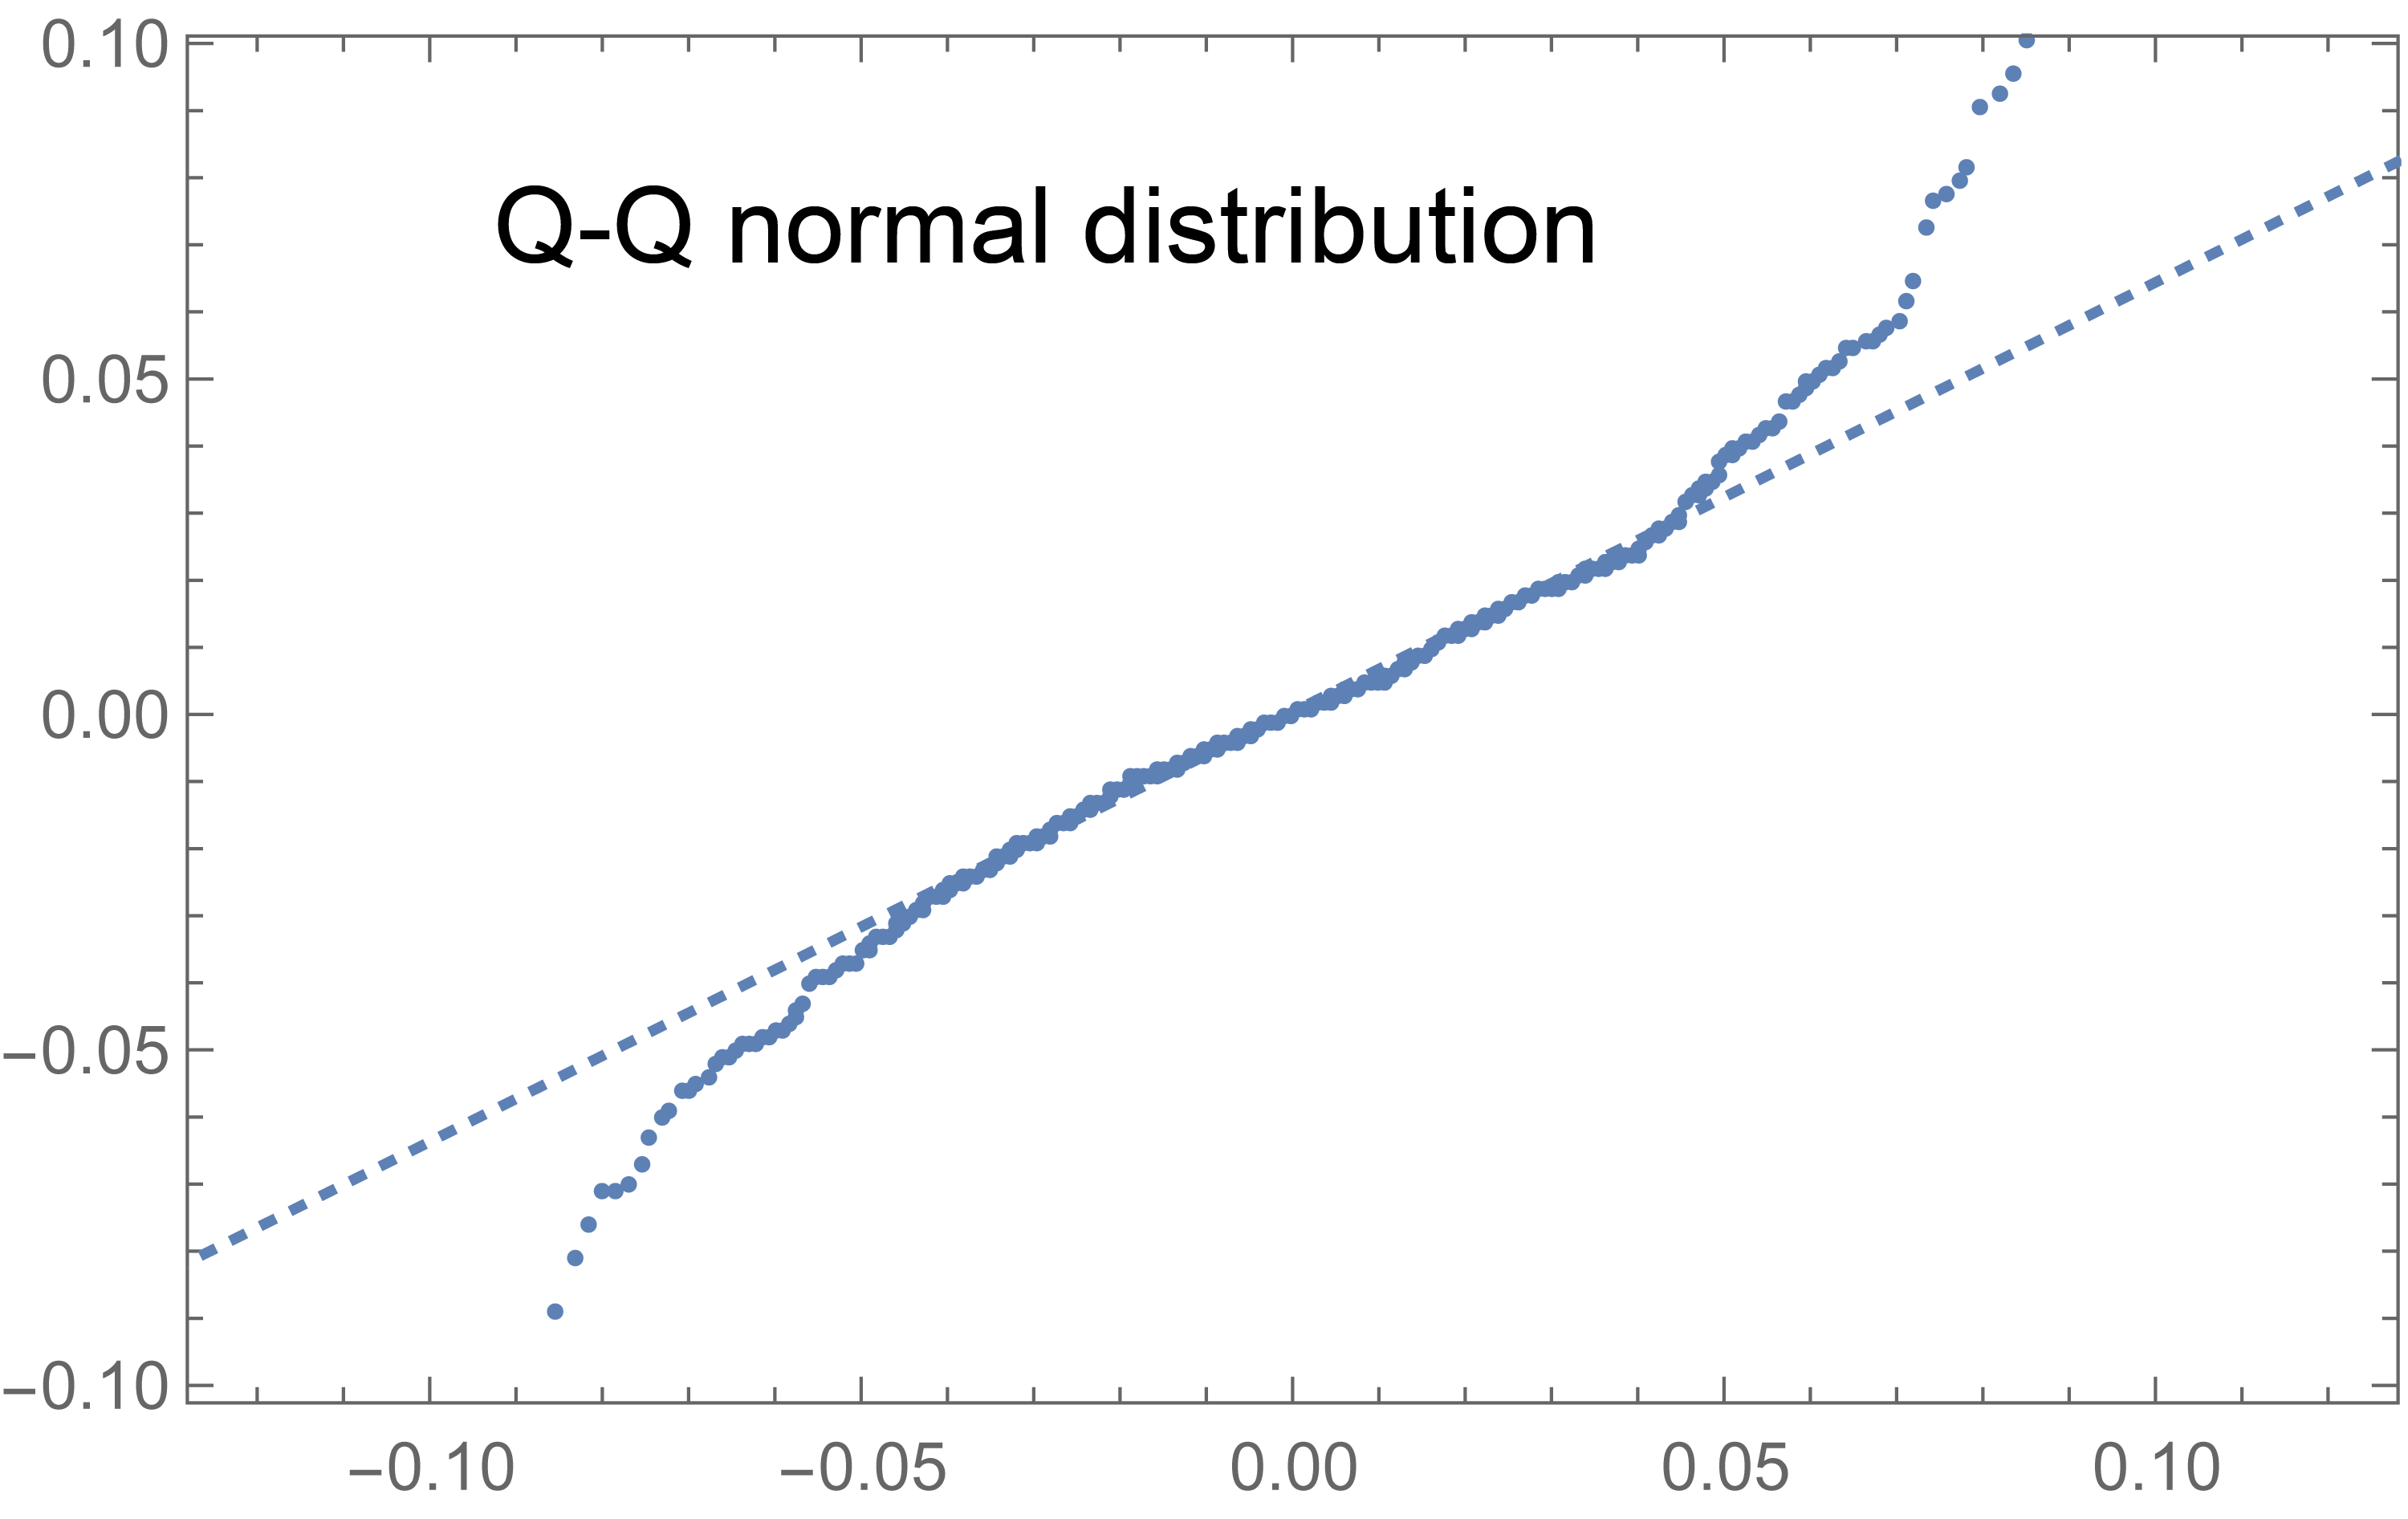
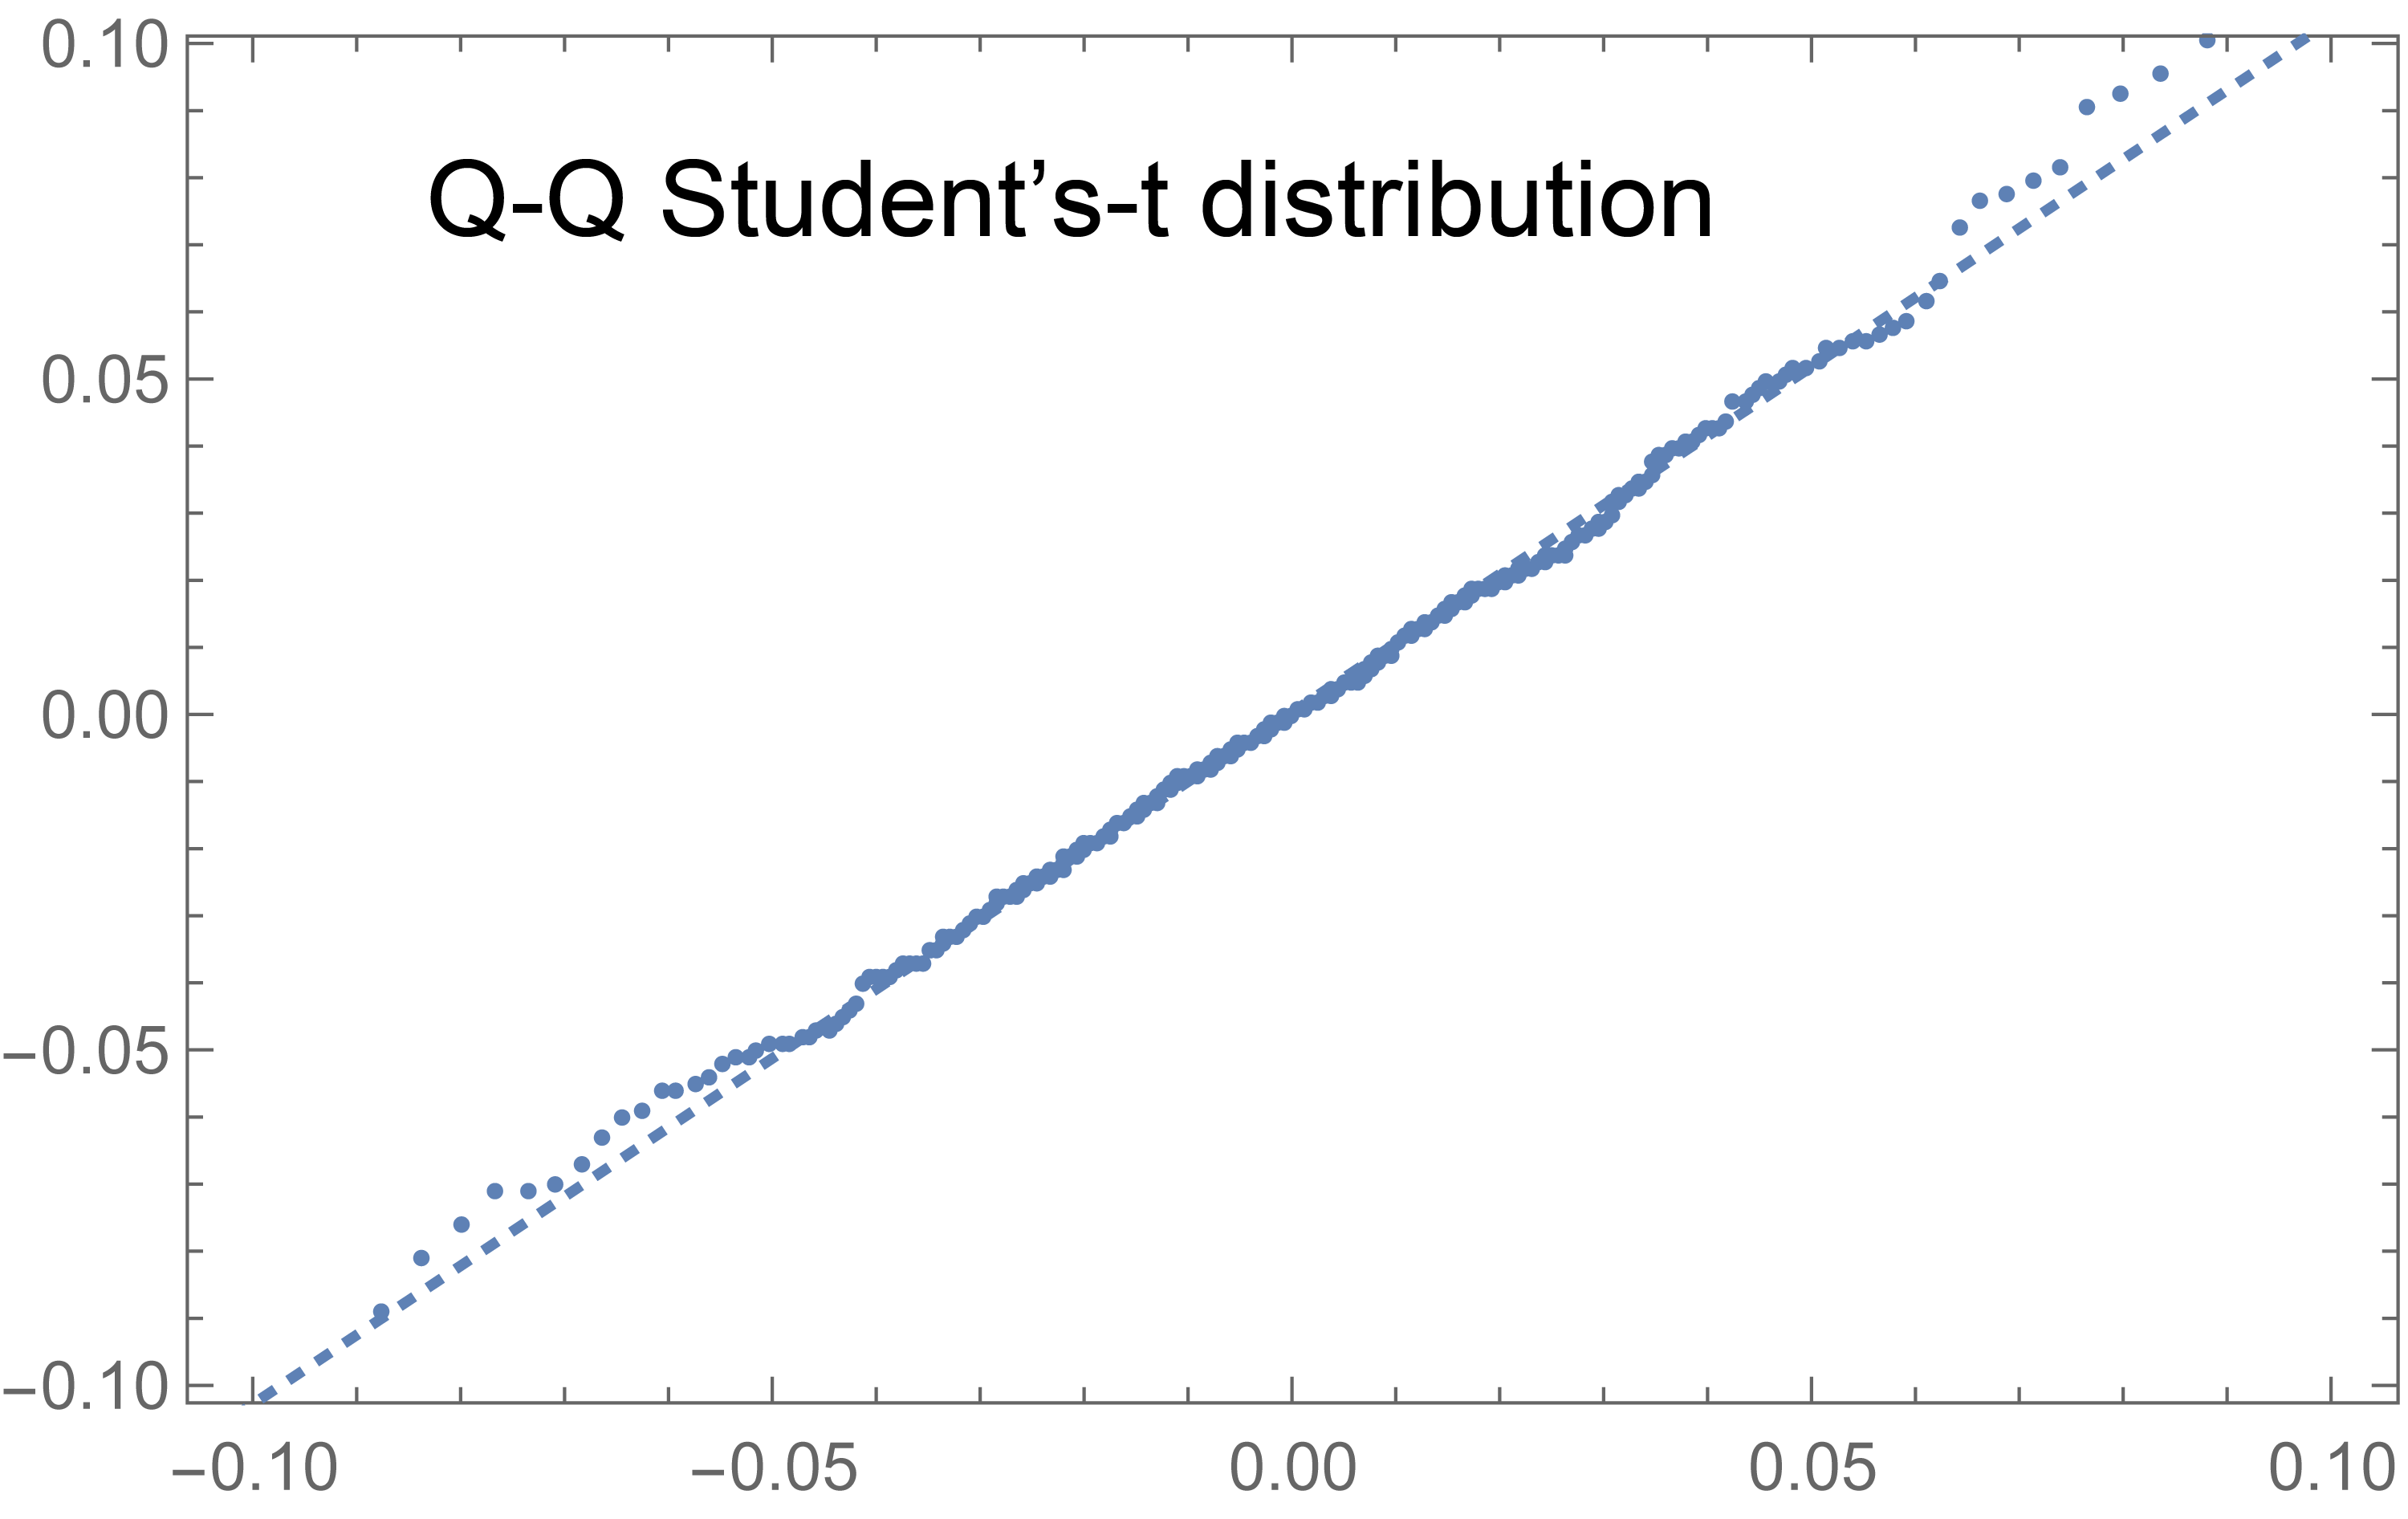
The spacing between the last two extreme values of a tail of a distribution is robust and has been used to measure tail heaviness here. Edit: In other words, yes, two widely spaced adjacent extreme values in either tail are enough to yield a low probability of normality. However, a distribution can be non-normal, as the Q-Q plot below shows enter image description here The same data plotted on a Student's-t Q-Q plot looks a lot better enter image description here

So, we ask, what is an outlier? One property of outliers is that they tend not to be reducible on any Q-Q plot. For example, the extreme version of the Student's t distribution with one degree of freedom is also called the Cauchy distribution. The Cauchy distribution has "explained" outliers so severe that the mean value is undefined, but the median value is not. To get an average value from a Cauchy distribution one can indeed trim outliers and then calculate a stable "trimmed" mean value which value then better agrees with the median value.

What then is an outlier given that extreme values can be produced by a heavy-tailed distributions? Here is a partial answer. If extreme values are trimmed and the resulting distribution only after trimming is a normal distribution and if we have very good reason to expect a normal distribution from other evidence, then the trimmed values were indeed erratic outliers.

$\endgroup$

Your Answer

By clicking “Post Your Answer”, you agree to our terms of service and acknowledge you have read our privacy policy.

Not the answer you're looking for? Browse other questions tagged or ask your own question.