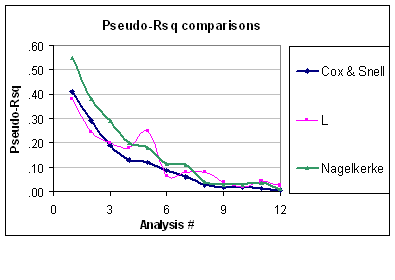
Both indices are measures of strength of association (i.e. whether any predictor is associated with the outcome, as for an LR test), and can be used to quantify predictive ability or model performance. A single predictor may have a significant effect on the outcome but it might not necessarily be so useful for predicting individual response, hence the need to assess model performance as a whole (wrt. the null model). The Nagelkerke $R^2$ is useful because it has a maximum value of 1.0, as Srikant said. This is just a normalized version of the $R^2$ computed from the likelihood ratio, $R^2_{\text{LR}}=1-\exp(-\text{LR}/n)$, which has connection with the Wald statistic for overall association, as originally proposed by Cox and Snell.
Other indices of predictive ability are Brier score, the C index (concordance probability or ROC area), or Somers' D, the latter two providing a better measure of predictive discrimination.
The only assumptions made in logistic regression are that of linearity and additivity (+ independence). Although many global goodness-of-fit tests (like the Hosmer & Lemeshow $\chi^2$ test, but see my comment to @onestop) have been proposed, they generally lack power. For assessing model fit, it is better to rely on visual criteria (stratified estimates, nonparametric smoothing) that help to spot local or global departure between predicted and observed outcomes (e.g. non-linearity or interaction), and this is largely detailed in Harrell's RMS handout. On a related subject (calibration tests), Steyerberg (Clinical Prediction Models, 2009) points to the same approach for assessing the agreement between observed outcomes and predicted probabilities:
Calibration is related to
goodness-of-fit, which relates to the
ability of a model to fit a given set
of data. Typically, there is no single
goodness-of-fit test that has good
power against all kinds of lack of fit
of a prediction model. Examples of
lack of fit are missed
non-linearities, interactions, or an
inappropriate link function between
the linear predictor and the outcome.
Goodness-of-fit can be tested with a
$\chi^2$ statistic. (p. 274)
He also suggests to rely on the absolute difference between smoothed observed outcomes and predicted probabilities either visually, or with the so-called Harrell's E statistic.
More details can be found in Harrell's book, Regression Modeling Strategies (pp. 203-205, 230-244, 247-249). For a more recent discussion, see also
Steyerberg, EW, Vickers, AJ, Cook, NR, Gerds, T, Gonen, M, Obuchowski, N, Pencina, MJ, and Kattan, MW (2010). Assessing the Performance of Prediction Models, A Framework for Traditional and Novel Measures. Epidemiology, 21(1), 128-138.

