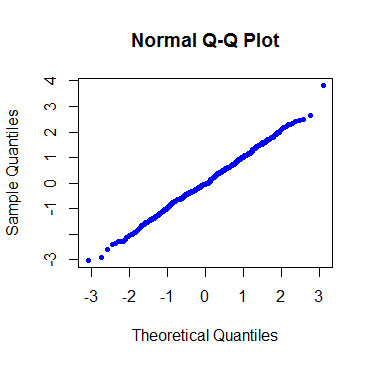
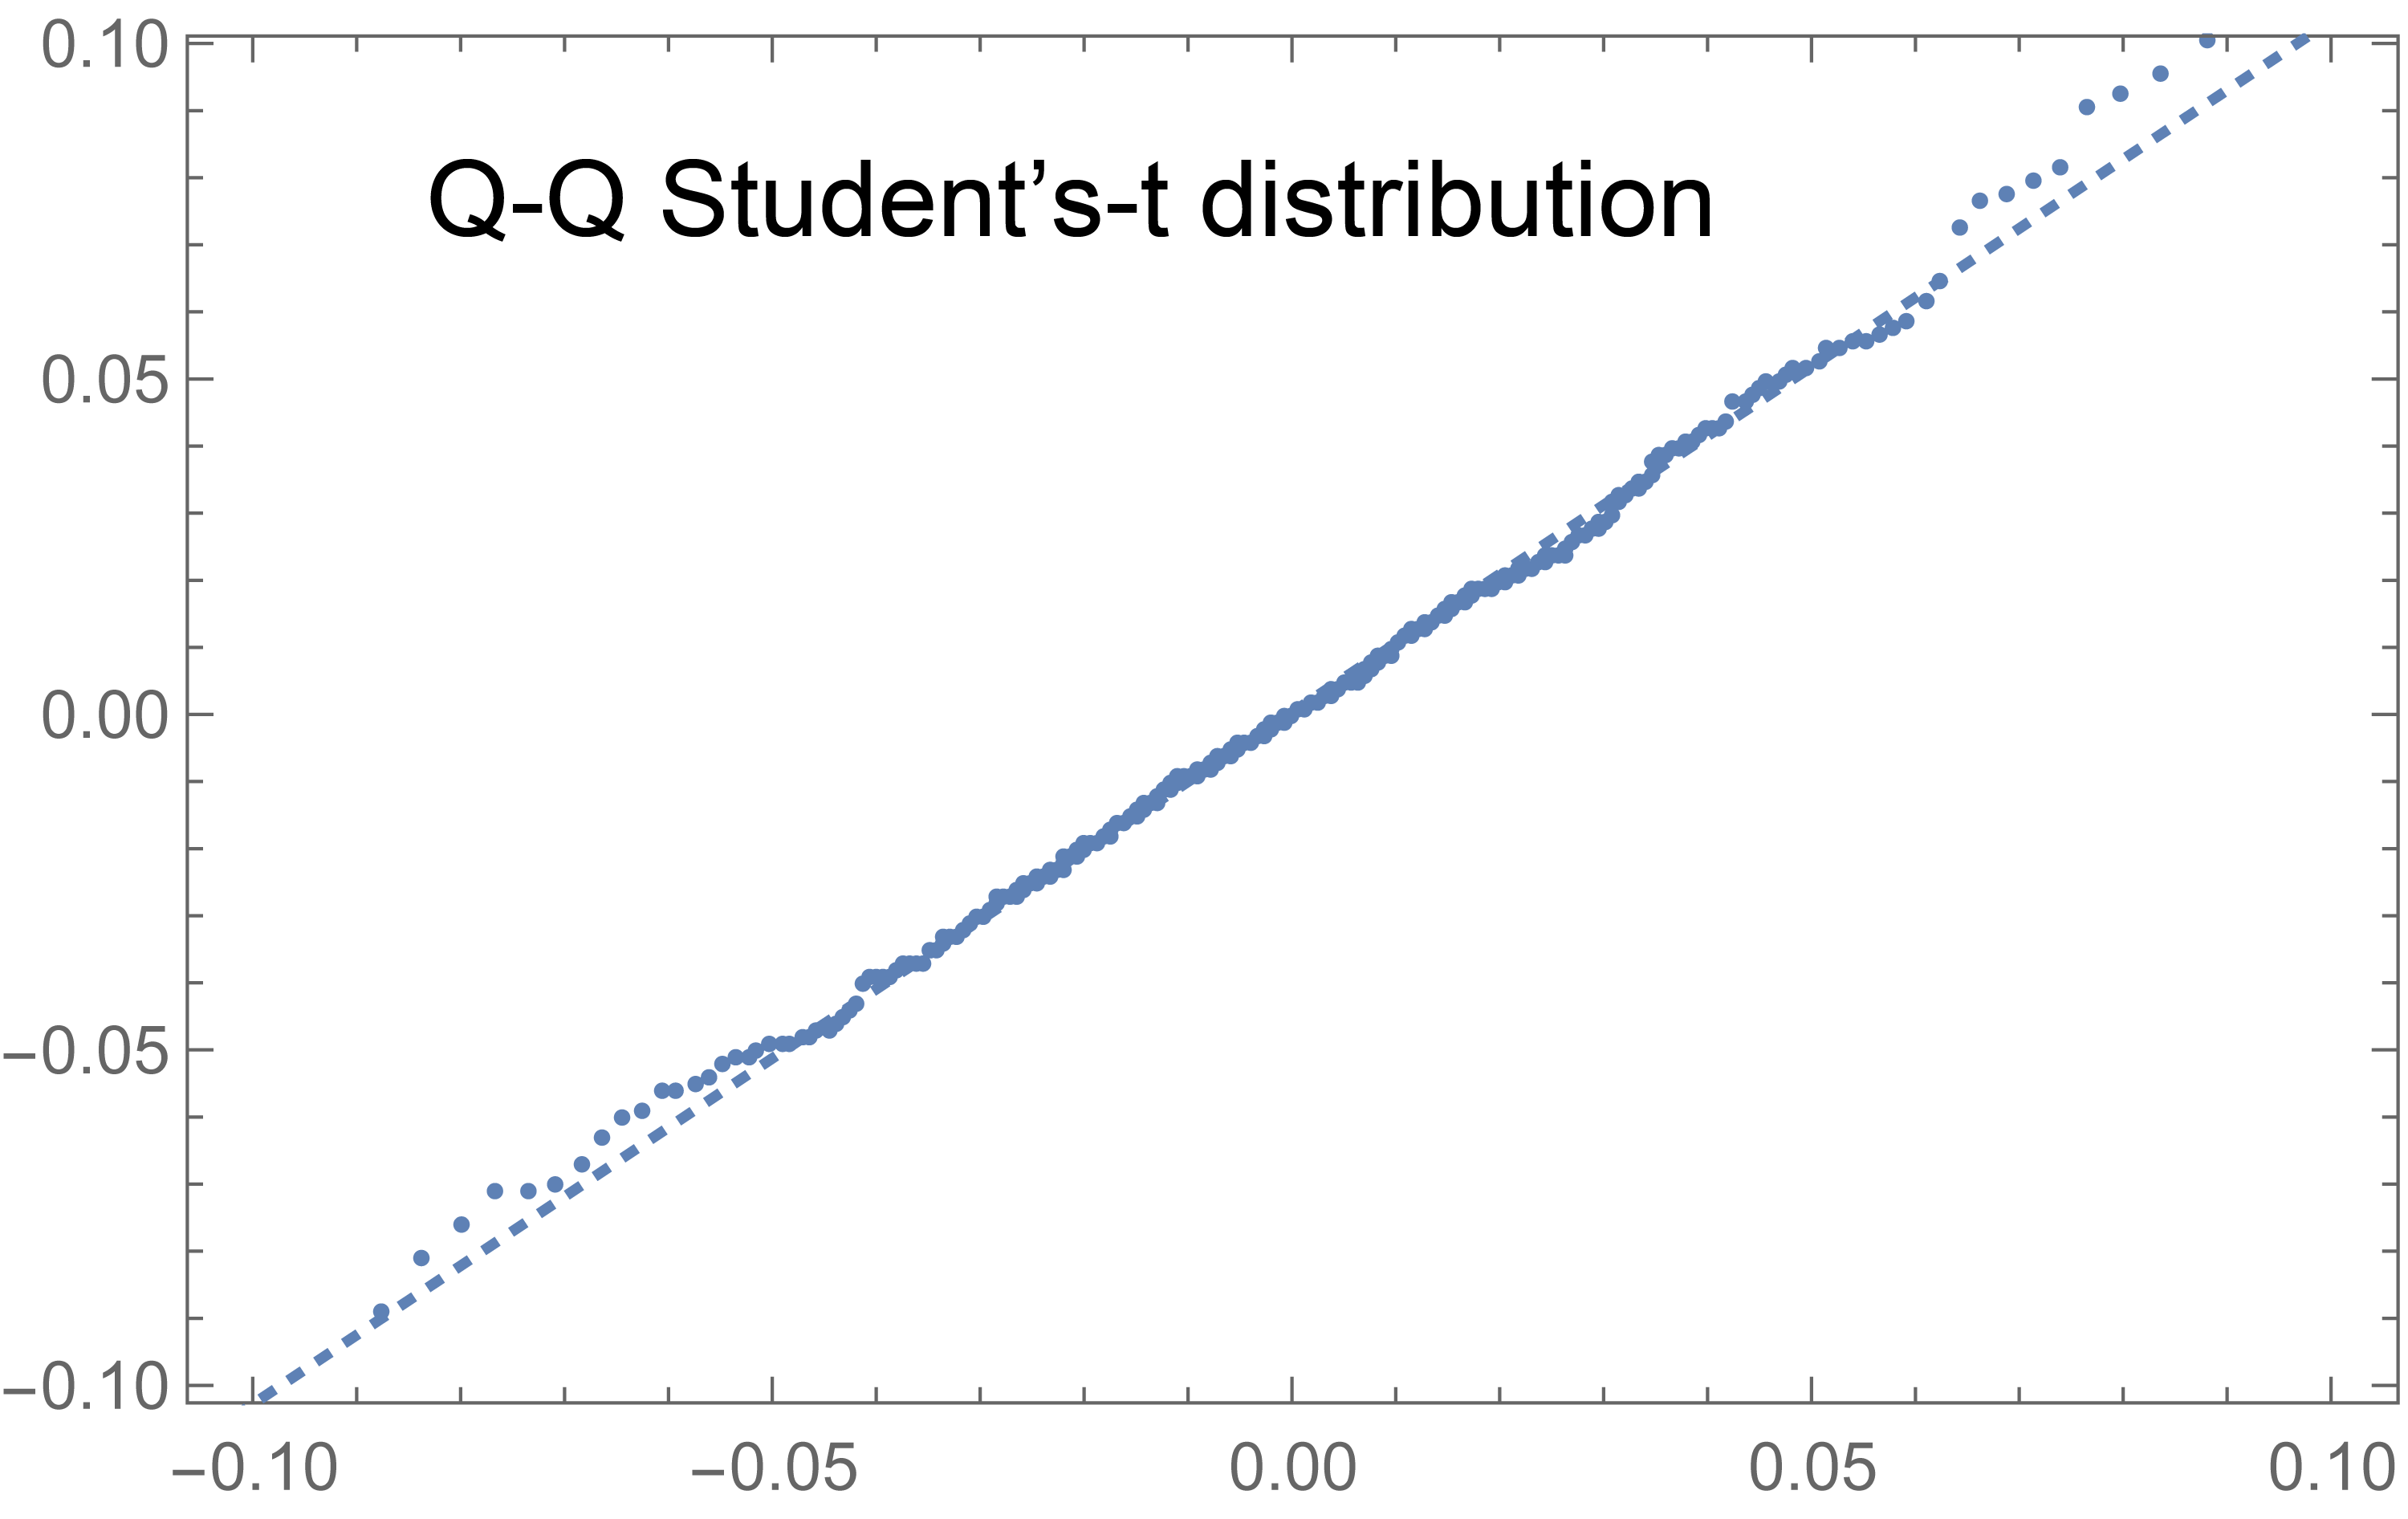
Looking at this post I started to wonder about the gestalt interpretation of the QQ plots generated by qqnorm in R. Here's the plot to avoid having to go to the linked post:
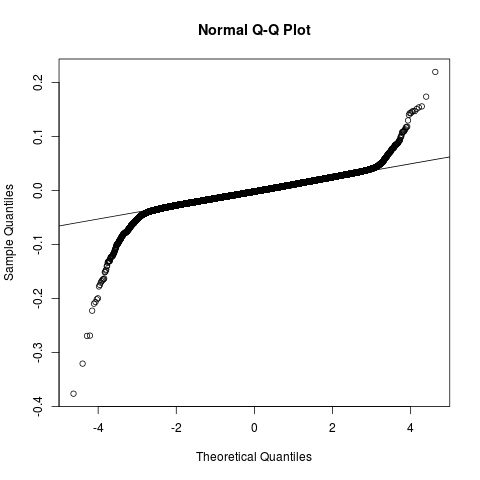
First off, the $y$ axis reads "quantiles", but these are not quantiles, but rather equally spaced values containing very few data points towards the ends. The plot also struck me as too horizontal to be interpreted in a gestalt fashion as a "heavy-tail" distribution.
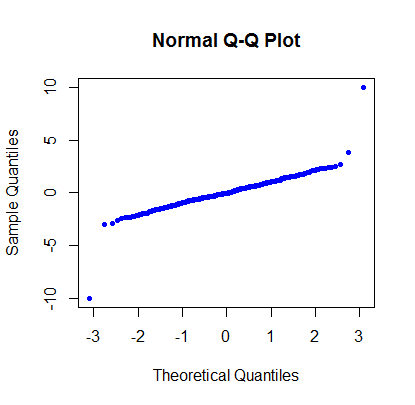
So I ran a quick "convincing-myself" test with R: To a $\small 500$ sample from a standard normal distribution, I added just a couple of asymptotic values $\small -10$ and $\small 10$. Just $\small 2$ data points: x <- c(rnorm(500),-10, 10). My thinking was that these two values couldn't possibly change our opinion - clearly the bulk of the data were normal by design. This was the obvious plot before introducing the -10, 10:
Two loose, possibly mistaken, values wouldn't make a dent. However, the plot was again "heavy-tailed" (not so unexpected now, given the observation on the $y$ axis construction):
... a ridiculously caricatured version of the first plot. My thought was that this could represent a well-known anomaly in some cases, warranting correcting. Surely statisticians must be in the habit of getting rid of these outliers... The most surprising part came when a Shapiro-Wilk test also seemed to comfortably rule out normality just because of these two values:
    Shapiro-Wilk normality test

data:  x
W = 0.8779, p-value < 2.2e-16
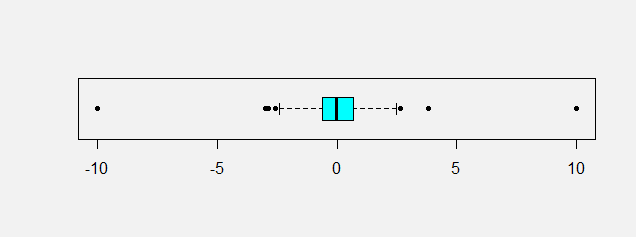
I guess this is consistent with the interpretation of the boxplot:
"If the box plot for the given data has outliers on both sides and has tails longer than the length of the box, then the data is said to have heavy-tailed distribution." An Insight Into Heavy-Tailed Distribution. Annapurna Ravi, Journal of Mathematical Sciences & Mathematics Education, Vol.5, No.1.
The question/-s:
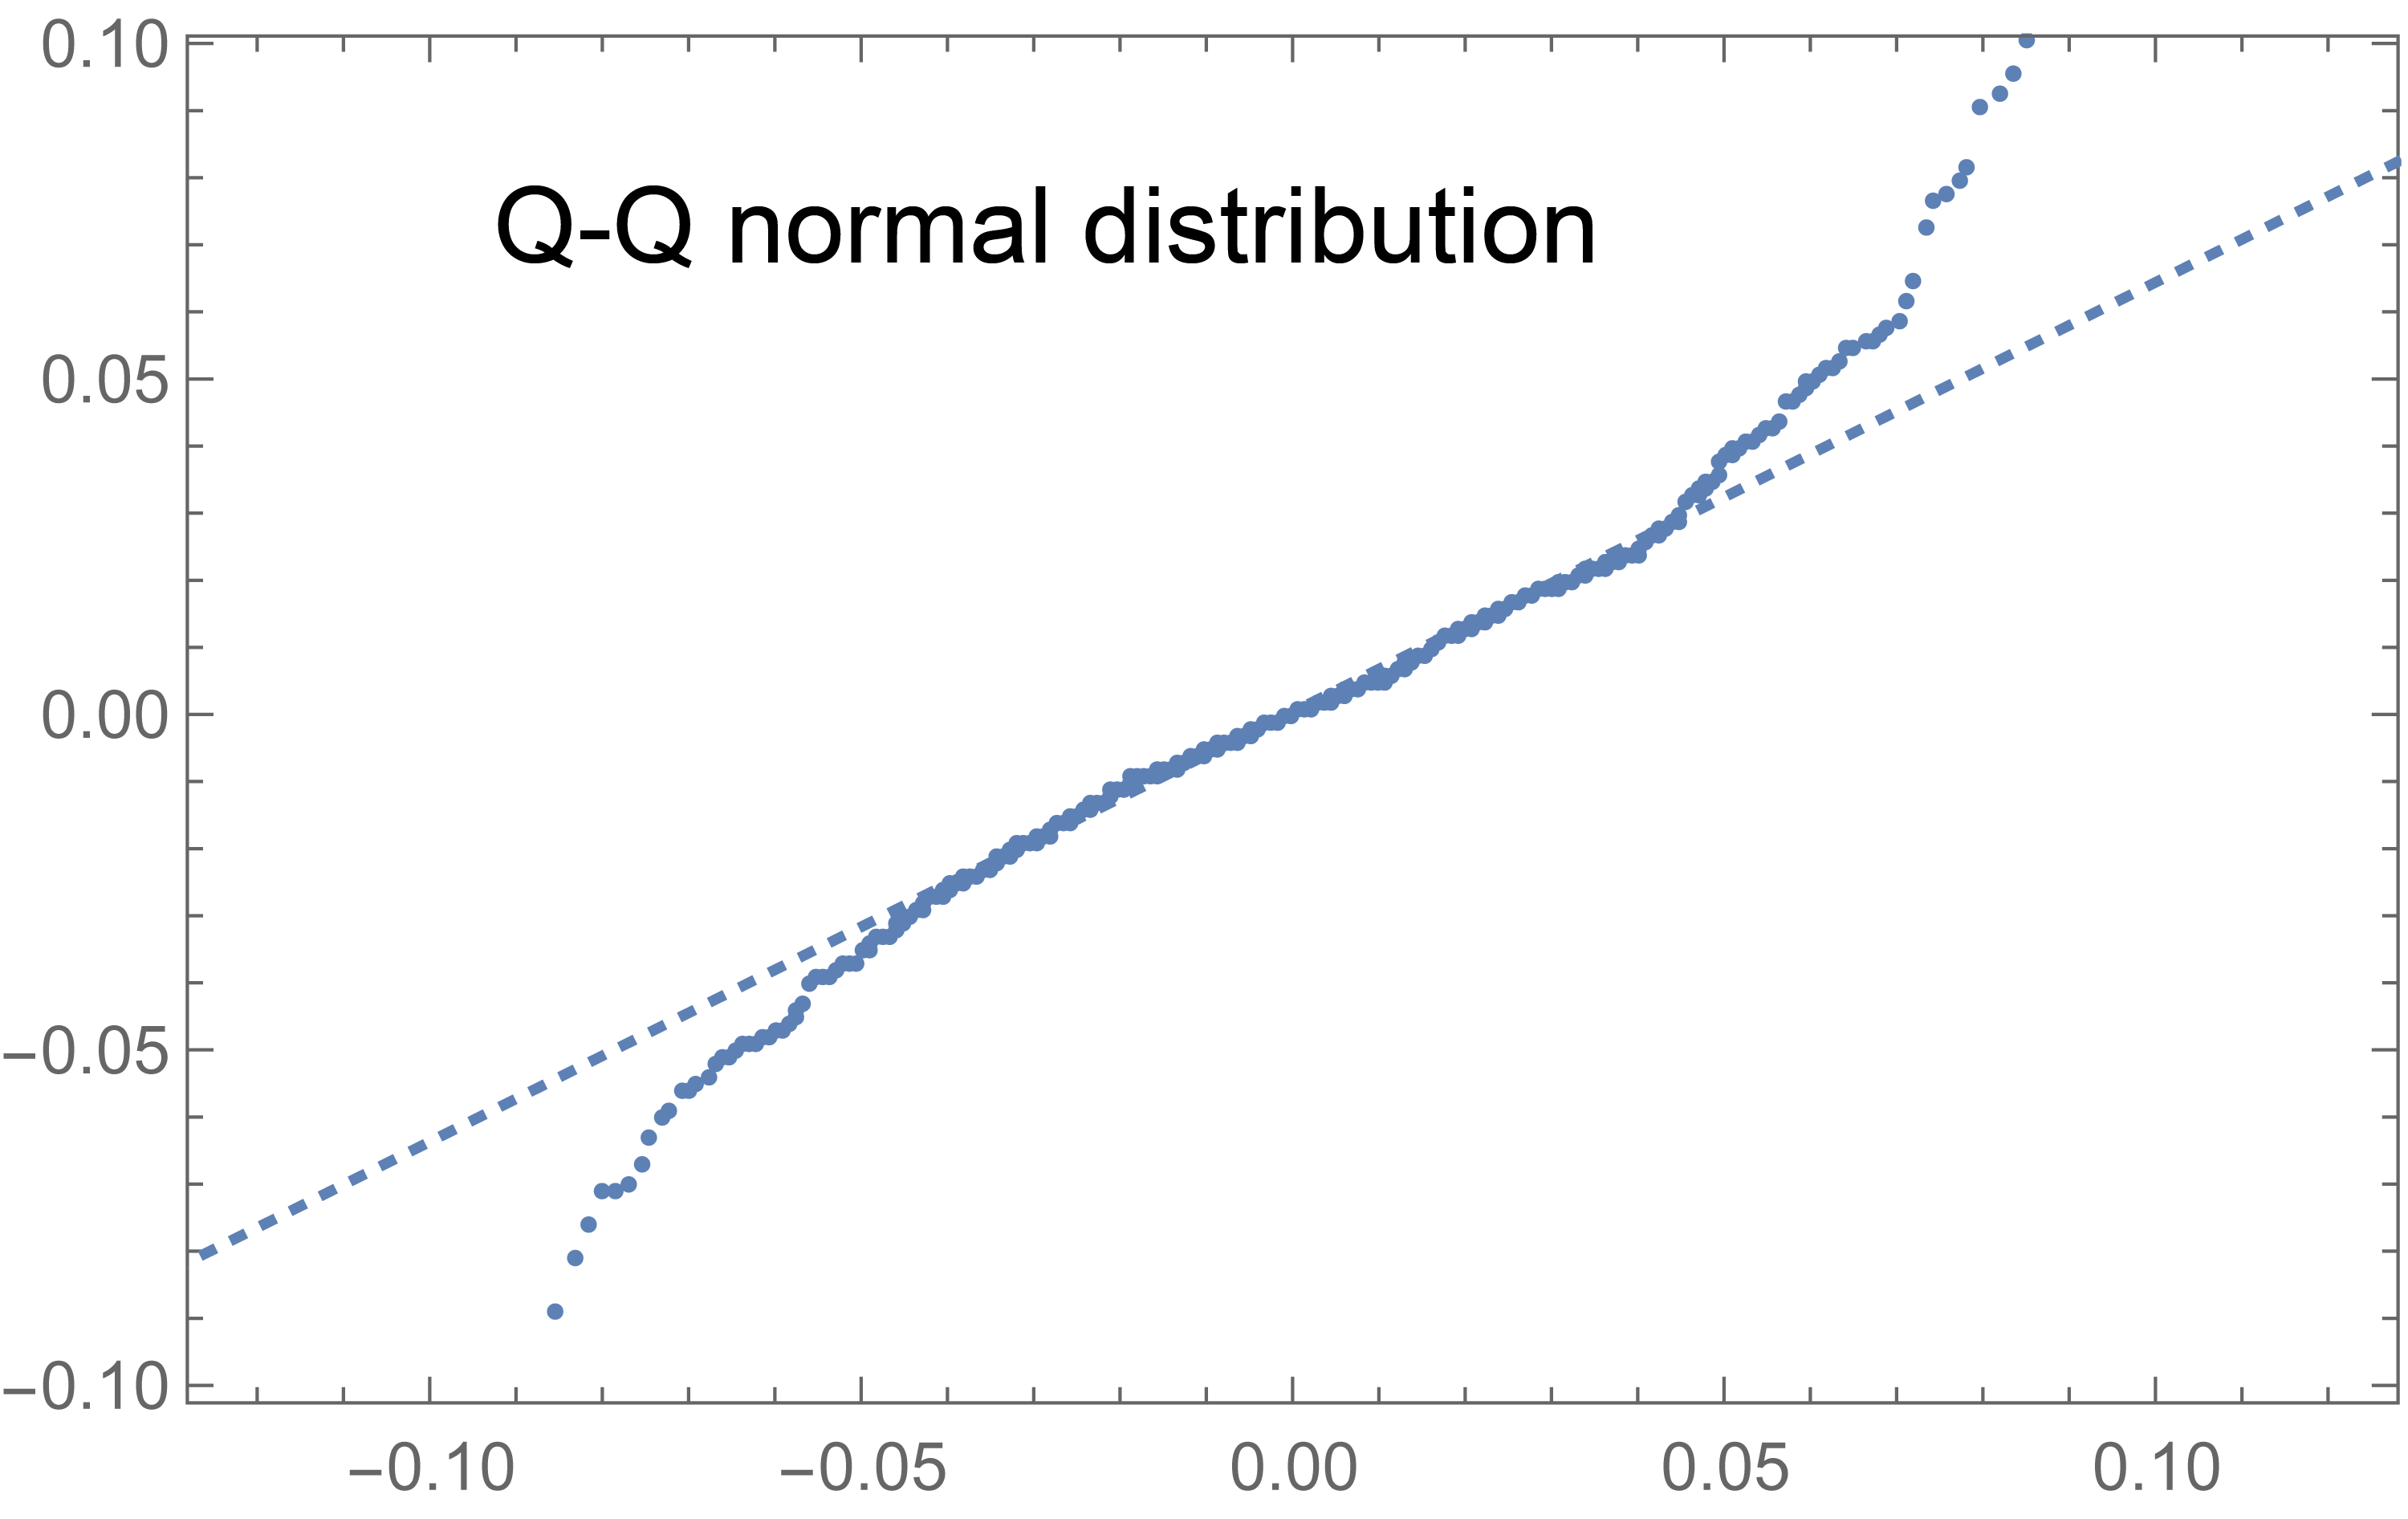
Are these essentially normal data no longer consistent with a normal distribution simply because of $2$ outliers? Can the new data be considered "heavy-tailed" because of these two dots sticking out at either end of the otherwise flat and straight QQ plot? And is this consistent with the mathematical definition of heavy tails?

