0
$\begingroup$

Lets say I know that I am going to store the information of 10,000 people each year for 4 years, that is 40,000 files. Now If I estimate that on the best case scenario the information from each person is going to weight .25MBytes, I believe there is a 50% chance that it will weight 1Mbyte, and I believe that the worst case scenario is that each person will require 5Mbytes...

Would it be ok for me to use the PERT formula (O + 4M + P)/6 and conclude ((.25 + 4(1) +5)/6 = 1.54) that my storage needs will be 40,000x1.5 = 60,000 Mbytes = 60 Gigabytes ?

I am trying to reach the answers "How likely would that be? ¿How can I know if that is X% likely?" numbers using Mathematica, so far it seems I can answer: How likely would that be? by writing this:

$Probability[x < 1.54, x \[Distributed] PERTDistribution[{0.25, 5}, 1]]$

I get a 0.55 probability of X being smaller than 1.54. ¿Correct?

I am asking this because I need to estimate the hardware requirements for a software system, and all the information I am given is that "I am going to store the information of 10,000 people each year for 4 years, that is 40,000 files". Once the system works for some months I will be able to use its behavior to predict its needs in a more accurately way, but in the meanwhile, I need to be able to give an initial estimate... and I am not sure on how to do that...

So. would it be safe to say that I have a 0.55 probability of my storage needs being smaller than 60 Gigabytes?

I am having some trouble beliving this is right, so I made the follwing experiment:

$Table[Fold[Plus, 0, RandomVariate[PERTDistribution[{.25, 5}, 1], 40000]], {10000}] $

To simulate the total size that I would need and, the thing is that this giving me a different answer than I would think:

If I do this:

$Quantile[Table[Fold[Plus, 0, RandomVariate[PERTDistribution[{.25, 5}, 1], 40000]], {10000}], 95/100]$

Answer: $61930.7$

It should give me the same answer as this (Should'nt it?) why it doesn't?

$(Quantile[PERTDistribution[{.25, 5}, 1], 95/100]) (40000)$

Answer: $121,938$

But it does not, it seems like estimating a single files size with 95% confidence and then multiplying it for 40,000 is very different...

Looking at my statistics books, this looks like the mistake in chapter 17 in "The Flaw of Averages" by by Dr. Sam Savage "The Flaw of Extremes" "In bottom - up budgeting, reporting the 90th percentile of cash needs leads to ever thicker layers of unnecessary cash as the figures are rolled up to higher levels. Even more harmful things result from focusing on above - or below - average results, such as test scores or health - related statistics."

I think that is why there is a difference, in this case, it is not bottom - up budgeting, but it is bottom - up file storage estimation, and the same rules should apply ¿no?

¿Is there a way to deal with this "symbolically" that is, without having to wait for slow simulated generation of sizes?

$\endgroup$

2 Answers 2

2
$\begingroup$

Let's say your estimate of a distribution is pretty much right. It looks like a log normal distribution with parameters 0 and 0.7:

enter image description here

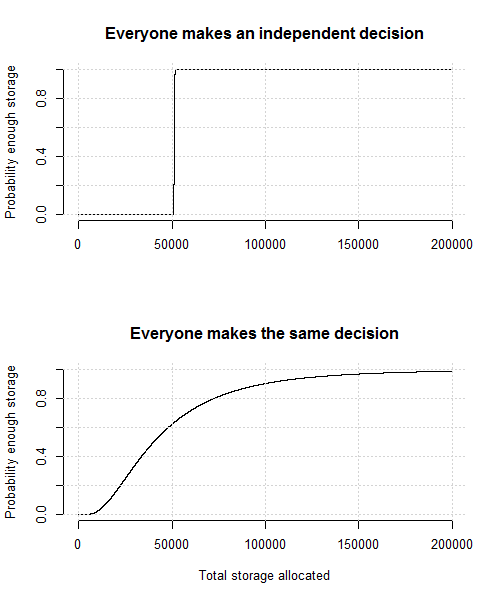
The mean of a variable with this distribution is 1.278 and the median is 1.00 (fitting with your estimate of the 50% likelihood value); the variance is 1.032 (more than you would estimate from the PERT method if I understand it correctly). If we took 40,000 independent instances of this variable and added them together we would get a new variable that is normally distributed (because of the central limit theorem), with mean $40000\times 1.278=51100$ and a standard distribution of only $\sqrt{40000*1.032}=203$. In other words, you are virtually certain the needed amount is within say 600 of 51100. This is the "flaw of averages" issue - if the random variables are independent then you really can say with a lot of certainty what is going to happen when you add enough of them up together; you don't need to add the worst likely scenario n times.

But lets take another possibility - there's no individual level randomness at all, all the users will end up using exactly the same amount of storage, perhaps because storage is dictated by environmental factors eg what software they have to use. This isn't as odd as it may sound, because technological change is surely a big source of the uncertainty in how much storage is needed, and its something that impacts on each individual in a common way. In this case, effectively your initial estimates just get multiplied by 40,000; if your worst case scenario of 5MB turns out to be true, it's true for everyone, every year and you need 200,000 MB of storage.

These two scenarios look like the following: enter image description here

Of course, the reality probably lies somewhere between these two. There's a chunk of uncertainty that impacts on everyone equally (including your own estimation skills); and then some individual randomness.

I appreciate this hasn't exactly answered your question, and I haven't engaged with the Mathematica or PERT issues at all. From what I can understand of your question and the other answer, it looks like the relevant Mathematica function is more in line with my cautious "everyone makes the same decision" approach. This seems to (sensibly) put a lot of weight on the uncertainty about the whole distribution and external environment.

I suppose my answer's theme, such as it is is that there is a lot of uncertainty about the uncertainty here - and that is just when we deal with the known unknowns. If we add into this any uncertainty about your initial parameter estimates, things get even wilder. So I would be very cautious about relying on the maths other than as a ballpark

$\endgroup$
1
$\begingroup$

I am trying to reach the answers "How likely would that be? ¿How can I know if that is X% likely?" numbers using Mathematica, so far it seems I can answer: How likely would that be? by writing this:

Probability[x<1.54,x[Distributed]PERTDistribution[0.25,5,1]] I get a 0.55 probability of X being smaller than 1.54. ¿Correct?

Yes your assumptions are correct and you have used the Mathematica function ( $Probability[x < 1.54, x \[Distributed] PERTDistribution[{0.25, 5}, 1]]$ ) in the right way.

You also have a 0.45 chance of your storage needs being larger than 60GB as well as 0.55 chance of it being smaller.

If you specify 128GB of storage you will have a 0.964 chance of your storage not being exceeded.

If you specify 256GB of storage you will have a probability of almost 1 that your storage will not be exceeded.

Unless you are using RAM or SSD why not specify 1 TB and be done with it :)

But it does not, it seems like estimating a single files size with 95% confidence and then multiplying it for 40,000 is very different... ¿where is the mistake? also ¿is there a way to deal with this mistake "symbolically" that is, without having to wait for slow generation of sizes?

Yes there is. Use the Mathematica function Probability and your chosen PERTDistribution, which will integrate the probability distribution correctly for you.

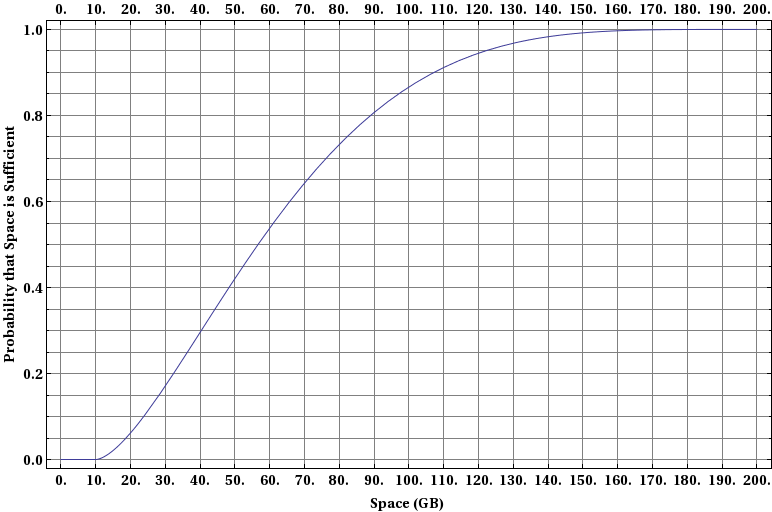
For your report perhaps you could consider including a graph such as this:

Mathematica graphics

Produced using the following Mathematica command:

With[{uLim = 5}, 
 Plot[CDF[PERTDistribution[{0.25, 5}, 1], x], {x, 0, uLim}, 
  FrameTicks -> {With[{ts = Range[0, uLim, 0.25]}, {ts, 
       40 ts}\[Transpose]], Automatic}, 
  GridLines -> {Range[0, uLim, 0.25], Range[0, 1, 0.05]}, 
  Frame -> True, LabelStyle -> Directive[Bold, Larger], 
  FrameLabel -> {"Space (GB) ", 
    "Probability that Space is Sufficient"}]]

which uses the Cumulative Distribution Function for the PERT distribution, CDF in Mathematica, which is effectively an aggregate of the probability that is below some value ( think of it as a plot of instantaneous values of the Probability function ).

You can then pose the question "What probability of storage exhaustion is acceptable to the organisation ?".

I'd be a little wary of the values of storage size for probabilities approaching unity, as the real distribution of file sizes is likely to have heavier tails than accounted for by the PERT distribution.

You may also want to consider your estimate of user numbers. You have a nice distribution estimate for file size, accounting for the potential variability in that quantity. However,you have a single fixed estimate for user numbers, 40,000, with no equivalent allowance for the potentially significant variation in this value. It might be wise to account for this uncertainty on your model.

$\endgroup$
9
  • $\begingroup$ ¿why not specify 1 TB and be done with it? Server resources upgrade cycle, they are offering me a server with 140Gbytes, or, a server with 1TB, if I choose wrong, I have to live with my wrong choice for 18 months before being able to apply for an upgrade (internal multi-national fortune 100 company with this silly impossible-to-change policy). Now the easy thing is to ask for the 1TB but they want a document justifying it BEFORE I even start coding the sytem that is going to run there (I also need to do the same with processor power, RAM usage and network traffic) $\endgroup$
    – Luxspes
    Commented Jul 8, 2012 at 3:26
  • $\begingroup$ I am being told (by some books I am reading) that one shouldn't just aggregate estimates... but in this case I am estimating the size of one file and then "aggregating" it 40,000 times to guess the storage capacity... ¿am I not violating this "do not just aggregate estimates" rule? ¿shouldn't I be using some special formula to estimate the full storage capacity instead of just making a multiplication? $\endgroup$
    – Luxspes
    Commented Jul 8, 2012 at 3:32
  • $\begingroup$ I agree that I should err on the side of caution in my spec, but, regardless of the possible error in my input parameters.. would my estimation be a lot more precise if, for example i were to generate a number of samples of data, and then re-compute thestatistics of those samples? $\endgroup$
    – Luxspes
    Commented Jul 8, 2012 at 9:18
  • $\begingroup$ For example, I could generate the 40,000 file sizes, 1000 times, and analize the resulting 1000 total file sizes (using something like $Table[RandomVariate[PERTDistribution[{0, 1}, 0.5], sampleSize], {i, numOfSamples}];$ But... ¿should I? $\endgroup$
    – Luxspes
    Commented Jul 8, 2012 at 9:22
  • $\begingroup$ Sorry @image_doctor but it appears that you were wrong, theres is a big difference between generate the 40,000 file sizes, 10,000 times and the current answer...(see the changes in the question) $\endgroup$
    – Luxspes
    Commented Jul 9, 2012 at 3:06

Your Answer

By clicking “Post Your Answer”, you agree to our terms of service and acknowledge you have read our privacy policy.

Not the answer you're looking for? Browse other questions tagged or ask your own question.