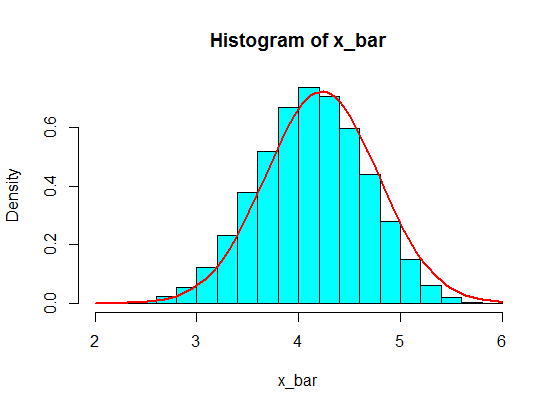
In general, the size of each sample should be more than $5$ for the CLT approximation to be good. A rule of thumb is a sample of size $30$ or more. But, with the population of your first example, $5$ is OK.
pop <- c(4, 3, 5, 6, 5, 3, 4, 2, 5, 4, 3, 6, 5)
N <- 10^5
n <- 5
x <- matrix(sample(pop, size = N*n, replace = TRUE), nrow = N)
x_bar <- rowMeans(x)
hist(x_bar, freq = FALSE, col = "cyan")
f <- function(t) dnorm(t, mean = mean(pop), sd = sd(pop)/sqrt(n))
curve(f, add = TRUE, lwd = 2, col = "red")

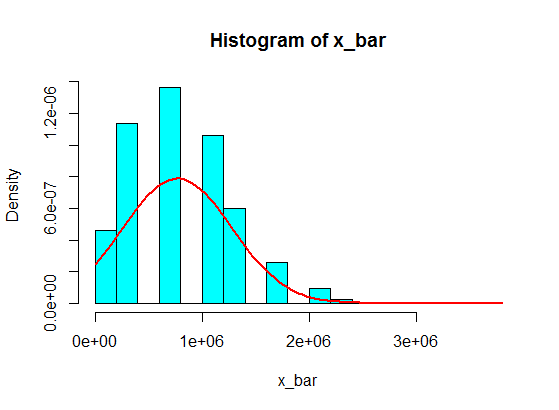
In your second example, because of the shape of the population distribution (for one thing, it's too much skewed; read the comments by guy and Glen_b bellow), even samples of size $30$ won't give you a good approximation for the distribution of the sample mean using the CLT.
pop <- c(4, 3, 5, 6, 5, 3, 10000000, 2, 5, 4, 3, 6, 5)
N <- 10^5
n <- 30
x <- matrix(sample(pop, size = N*n, replace = TRUE), nrow = N)
x_bar <- rowMeans(x)
hist(x_bar, freq = FALSE, col = "cyan")
f <- function(t) dnorm(t, mean = mean(pop), sd = sd(pop)/sqrt(n))
curve(f, add = TRUE, lwd = 2, col = "red")

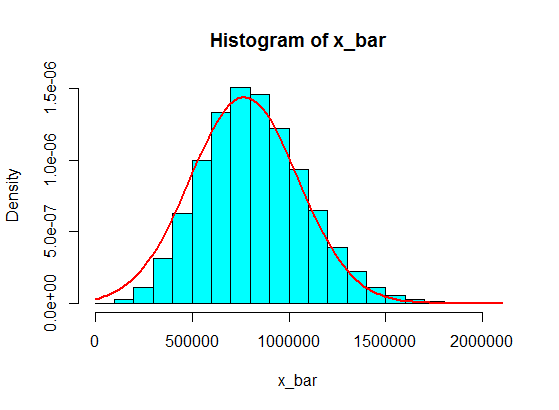
But, with this second population, samples of, say, size $100$ are fine.
pop <- c(4, 3, 5, 6, 5, 3, 10000000, 2, 5, 4, 3, 6, 5)
N <- 10^5
n <- 100
x <- matrix(sample(pop, size = N*n, replace = TRUE), nrow = N)
x_bar <- rowMeans(x)
hist(x_bar, freq = FALSE, col = "cyan")
f <- function(t) dnorm(t, mean = mean(pop), sd = sd(pop)/sqrt(n))
curve(f, add = TRUE, lwd = 2, col = "red")


