@Dave mentions the speed of convergence in the Central Limit Theorem.
The shape of the distribution from which samples are taken can make
a big difference in the speed of convergence.
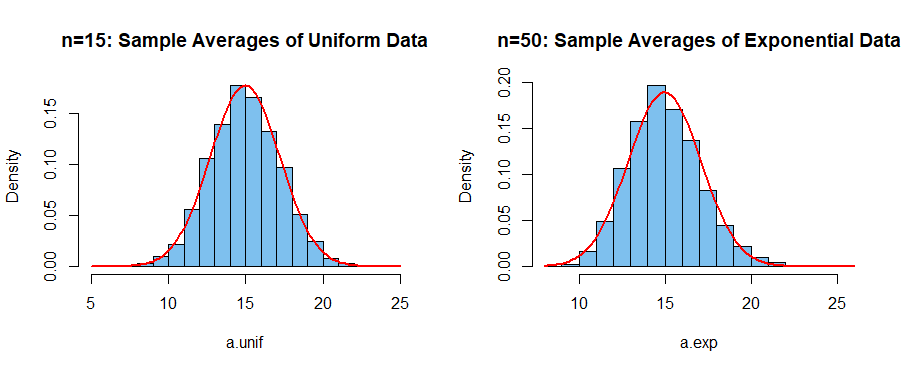
- Means of samples of size 15 from a uniform distribution are very nearly
normally distributed. So a sample of size $n = 30$ would easily be large enough to use t tests.
- Means of samples of size 50 from an exponential distribution are not normal. So a sample of size $n = 30$ would not be large enough
to use t tests (150 would be a lot better).
Usually, the 'rule of 30' is accompanied by warnings that it may not
apply when data show extreme skewness or many outliers. Figure below
shows two histograms, each for 10,000 means.
Means of 15 uniform
observations in the left panel, and means of 50 exponential observations
at right. Red curves are normal curves that match the mean and SD in
the respective histograms. (R code for the simulations and making the figure is shown below the figure.)

set.seed(2020)
a.unif = replicate(10^4, mean(runif(15, 0,30)))
a.exp = replicate(10^4, mean(rexp(50, 1/15)))

par(mfrow=c(1,2))
 hist(a.unif, prob=T, col="skyblue2",
      main="n=15: Sample Averages of Uniform Data")
  curve(dnorm(x, mean(a.unif), sd(a.unif)), add=T, col="red", lwd=2)
 hist(a.exp, prob=T, col="skyblue2",
      main="n=50: Sample Averages of Exponential Data")
  curve(dnorm(x, mean(a.exp), sd(a.exp)), add=T, col="red", lwd=2)
par(mfrow=c(1,1))
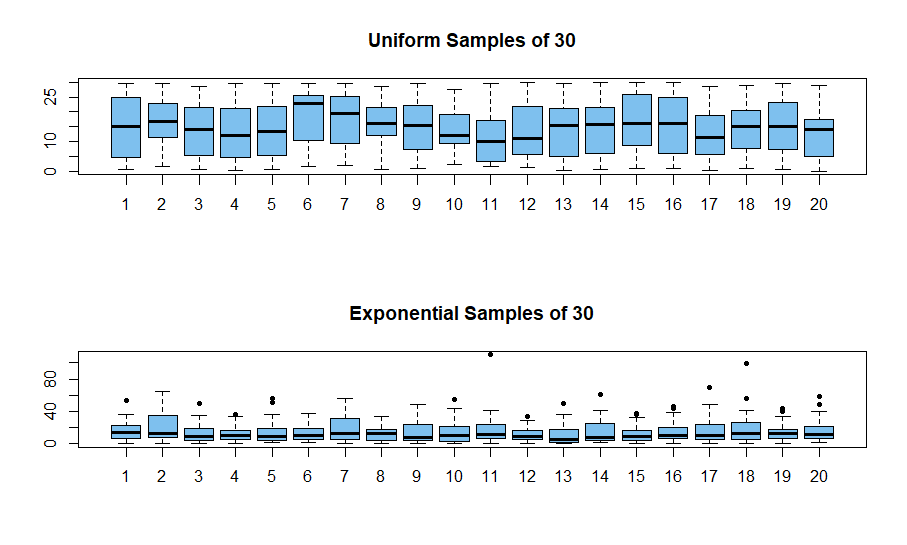
About outliers: Samples of size 30 from a uniform distribution very seldom have boxplot outliers--less than 1 in 100 do. By contrast, about 75% of samples of size 30 from
an exponential distribution have outliers in a boxplot and most have their upper whisker longer than the lower one, indicating upward skewness. So data frequently show warning signs
when t tests are inappropriate.
All
histograms in the figure below are based on samples of size 30,
from uniform distributions at the top, exponential distributions in the bottom panel.


