3
$\begingroup$

in a plot of my time series there is clearly visible that there is structural break, but I have to find the exact date. I want test this with the chow test. Although I understand how to perform this test if the date of the structural break is know, by simply using a linear regression with two dummy's one for the intercept and one for the slope,

$R_t$ = $\beta_0 $+ $\beta_0^* · D_i + \beta_1 R_{m,t} + \beta_1^* · D_t · R_{m,t} + ε_t,$

Than using the chow test.. But if I do not know the exact date, (in other words: I do not know when $D_i$ and $D_t$ should be 1) how can I find the exact date?

Thank you very much for reply

$\endgroup$
1
  • $\begingroup$ You tagged the question as "cointegration", but do not mention it... are you asking for a "normal" relationship, or one where R and R_m might are potentially unit roots? $\endgroup$
    – Matifou
    Commented Jun 18, 2014 at 16:06

2 Answers 2

2
$\begingroup$

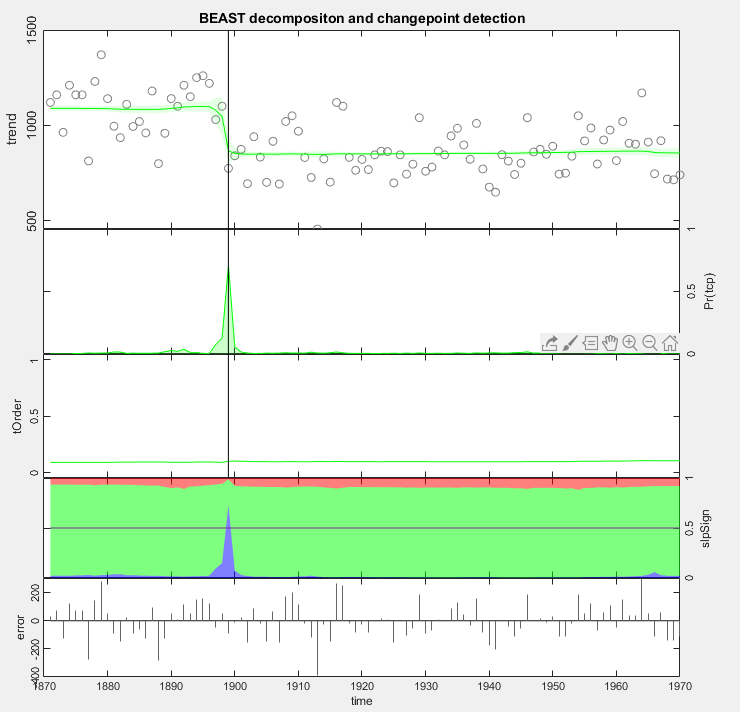
Not sure how it is relevant to the original question. But just in case somebody still needs an answer to this old question, one possible tool in Matlab is the BEAST method I developed, available at https://www.mathworks.com/matlabcentral/fileexchange/72515-bayesian-changepoint-detection-time-series-decomposition. For good or bad, it is a Bayesian changepoint detection algorithm.

It can be installed by running

eval(  webread( 'http://b.link/rbeast', weboptions('cert','') )  );

Then, here is a quick test:

 load('Nile.mat')                                   % annual streamflow of the Nile River startin from year 1871
 out = beast(Nile, 'season', 'none','start', 1871)  % trend-only data without seasonality
 printbeast(out)
 plotbeast(out)

Given below is the plotting of the example: enter image description here

More details about the toolbox are also available at https://github.com/zhaokg/Rbeast.

$\endgroup$
1
$\begingroup$

Your approach may work BUT lacks significant generality. You might want to review Change and anomaly detection as it raises issues about change point detection Your approach assumes a known date and a specific kind of change whereas the work of Tsay http://www.unc.edu/~jbhill/tsay.pdf and others actually can find the date of not only a change in the expected value but a change in the error variance. These methods and others such as detecting paramter changes in general and variance changes have been implemented fully in AUTOBOX and to a much lesser degree in SAS and SPSS. Automatic Forecasting Systems offers a complete 30 day free trial version so I suggest that you go to http://www.autobox.com/cms/ and avail yourself to this version. For transparency purposes you should know that I was involved in the design and implementation of change point methodologies for this software and am considered (by some) to be a thought leader in that field.. Some of my guidance came from http://www.osti.gov/scitech/biblio/161513

$\endgroup$

Your Answer

By clicking “Post Your Answer”, you agree to our terms of service and acknowledge you have read our privacy policy.

Not the answer you're looking for? Browse other questions tagged or ask your own question.