6
$\begingroup$

I'd like to calculate the confidence interval for a variable with a lower bound and I can't seem to figure out how to do so. I've seen several similar posts, but none answered my question, at least not directly. I use a toy example here for simplicity.

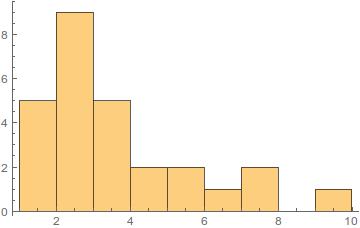
To be concrete lets consider the distribution (I chose these numbers myself so it kind of looks like a Poisson distribution),

{1,2,3,5,1,2,2,3,7,2,3,4,1,5,7,6,4,1,2,2,3,9,2,1,2,2,3}

which is shown below,

enter image description here

If I calculate the standard deviation and mean for this distribution I get 3.1 and 2.4 respectively, but since the distribution isn't a normal distribution this doesn't really give me the confidence interval. How would I go about calculating the confidence interval properly?

$\endgroup$
7
  • 4
    $\begingroup$ Another option is to use bootstrapping to get a confidence interval, then you don't have to make assumptions or rely on Normal theory. $\endgroup$
    – user44764
    Commented Jul 18, 2014 at 19:17
  • 3
    $\begingroup$ ms.mcmaster.ca/peter/s743/poissonalpha.html $\endgroup$
    – whuber
    Commented Jul 18, 2014 at 19:27
  • $\begingroup$ (1) Are you sure you mean confidence interval, rather than say a tolerance interval or a prediction interval, or some other interval? (2) If the answer to (1) is 'yes, definitely a confidence interval', then a confidence interval for what, precisely? $\endgroup$
    – Glen_b
    Commented Jul 19, 2014 at 10:23
  • $\begingroup$ @whuber: Thanks for the link. Can you clarify what is meant by the function qchisq? I tried to find the equivalent function is Mathematica and the closest I found was ChiSquareDistribution, but that doesn't seem to be it. $\endgroup$
    – JeffDror
    Commented Jul 19, 2014 at 13:13
  • 2
    $\begingroup$ @whuber: Thanks! I am now able to reproduce the tables presented in the link. I think the link answers the question, "For a given bin in the histogram, between which interval do we expect the number of counts to lie 95% of the time?" Is there a similar way to answer the question, "In which interval will 95% of the measurements lie?" (i.e. not for a specific bin) $\endgroup$
    – JeffDror
    Commented Jul 20, 2014 at 15:43

3 Answers 3

3
$\begingroup$

This answer is based on the clarification offered in comments:

I'd like to make a statement such as ... "I am 68% sure the mean is between $3.1−σ_−$ and $3.1+σ_+$", and I want to calculate $σ_+$ and $σ_−$.

I think that at least in the physics world this is called a confidence interval.

Let's take it as given that in response to my question "confidence interval for what?" you responded that want a confidence interval for the mean (and as made clear, not some other interval for values from the distribution).

There's one issue to clear up first - "I am 68% sure the mean is between" isn't really the usual interpretation placed on a confidence interval. Rather, it's that if you repeated the procedure that generated the interval many times, 68% of such intervals would contain the parameter.

Now to address the confidence interval for the mean.

I agree with your calculation of mean and sd of the data:

> x=c(1,2,3,5,1,2,2,3,7,2,3,4,1,5,7,6,4,1,2,2,3,9,2,1,2,2,3)
> mean(x);sd(x)
[1] 3.148148
[1] 2.106833

However, the mean doesn't have the same sd as the population the data was drawn from.

The standard error of the mean is $\sigma/\sqrt{n}$. We could estimate that from the sample sd (though if the data were truly Poisson, this isn't the most efficient method):

> sd(x)/sqrt(length(x))
[1] 0.4054603

If we assumed that the sample mean was approximately normally distributed (but did not take advantage of the possible Poisson assumption for the original data), and assumed that $\sigma=s$ (invoking Slutsky, in effect) then an approximate 68% interval for the mean would be $3.15\pm 0.41$.

However, the sample isn't really large enough for Slutsky. A better interval would take account of the uncertainty in $\hat \sigma$, which is to say, a 68% t$_{26}$-interval for the mean would be

$3.15\pm 1.013843\times 0.41$

which is just a fraction wider.

Now, as for whether the sample size is large enough to apply the normal theory CI we just used, that depends on your criteria. Simulations at similar Poisson means (in particular, ones deliberately chosen to be somewhat smaller than the observed one) at this sample size suggest that using a t-interval will work quite well for similar Poisson rates and 27 observations or more.

If we take account of the fact that the data are (supposedly) Poisson, we can get a more efficient estimate of the standard deviation and an interval for $\mu$, but if there's any risk the Poisson assumption could be wrong - a chance of overdispersion caused by some homogeneity of Poisson parameters, say - then the t-interval would probably be better.

Nevertheless, we should consider that specific question - "how to get a confidence interval for the population mean of Poisson variables" -- but this more specific question has already been answered here on CV - for example, see the fine answers here.
$\endgroup$
5
  • $\begingroup$ Thank you very much for response. It really helps. As a follow-up question, if I wanted to know the answer to the question "In what interval will 68% of measurements lie?", what would I need to do? I assume if it were normally distributed then we just use sd(x), but what can we do if its a highly skewed distribution? $\endgroup$
    – JeffDror
    Commented Jul 20, 2014 at 14:58
  • $\begingroup$ Never mind, I just realized for this I can just take the 14th and 86th percentile. Thanks again! $\endgroup$
    – JeffDror
    Commented Jul 20, 2014 at 19:25
  • 1
    $\begingroup$ (1) Corresponding quantiles of the observed data DOES NOT give a 68% interval for the mean! This was the whole point of the question I first asked in comments - don't calculate an interval for the wrong thing! (2) that's nonparametric; why specify anything about the distribution? (3) You mean 16th and 84th, in any case. $\endgroup$
    – Glen_b
    Commented Jul 20, 2014 at 19:45
  • $\begingroup$ Yes, sorry I misspoke. I agree that it doesn't give the 68% interval for the mean. As well as the confidence interval of the mean I also wanted something to describe the distribution because in my particular case its interesting how spread the datapoints are (not just how precise we know the mean). It doesn't necessarily need to be formal so I figured I'd use the 16th and 84th percentile points. Do you know of a better solution? $\endgroup$
    – JeffDror
    Commented Jul 20, 2014 at 21:35
  • $\begingroup$ It depends on what aspect of the distribution you want to describe. There's nothing wrong with quantiles if they capture what you're interested in. A better solution would require more information about what you need to be able to say. $\endgroup$
    – Glen_b
    Commented Jul 20, 2014 at 22:46
1
$\begingroup$

It was mentioned in the comments on the original post but here it is more explicitly. The bootstrap is simple to use and has a ton of nice asymptotic theory behind it, e.g. Shao and Tu, 1995. Here's some R code which does what I think you want:

the_data = c(1,2,3,5,1,2,2,3,7,2,3,4,1,5,7,6,4,1,2,2,3,9,2,1,2,2,3)
n_resamples = 1000
n_data = length(the_data)
bootstrap_mean = NULL
for(ii in 1:n_resamples){
  bootstrap_sample = the_data[sample(1:n_data, size = n_data, replace = T)]  
  bootstrap_mean = c(bootstrap_mean, mean(bootstrap_sample))
}
plot(density(bootstrap_mean), main = "")
## 68% bootstrap confidence interval
lower_bound = 0.16
upper_bound = 0.84
quantile(bootstrap_mean, probs = c(lower_bound, upper_bound))

For one run I get:

     16%      84% 
2.740741 3.592593 
$\endgroup$
2
  • $\begingroup$ Thanks, I will definitely apply this technique, as my real data is highly skewed. I'm unfamiliar with R code so I'll likely implement it into Mathematica. Can you explain what the "for(ii in 1:n_resamples){ bootstrap_sample = the_data[sample(1:n_data, size = n_data, replace = T)] bootstrap_mean = c(bootstrap_mean, mean(bootstrap_sample)) }" segment is doing? The rest I think is self explanatory. $\endgroup$
    – JeffDror
    Commented Jul 20, 2014 at 19:32
  • $\begingroup$ The "grand idea" behind the bootstrap is that you create a bunch (at least 1000) pseudo-datasets, calculate your statistic of interest, and utilize that statistic's empirical distribution over all the pseudo-datasets. The pseudo-datasets are, importantly, drawn from the real dataset with replacement and so that the pseudo-dataset has the same number of observations as the real dataset. $\endgroup$
    – Zoë Clark
    Commented Jul 20, 2014 at 19:42
0
$\begingroup$

For skewed distributions the confidence interval is tricky. One way to proceed is by having equal quantiles from tails. So, for instance, if you wish to have 95% confidence interval, you'd get 2.5% and 97.5% quantiles.

Your comment about $\pm\sigma$ being 68% CI in physics is only true when you assume normal-ish distribution. The Poisson distribution is quite not like normal, it's asymmetric(skewed) and has a lower bound as you noted. If you really want 68%, then get 15% and 84% quantiles.

$\endgroup$

Your Answer

By clicking “Post Your Answer”, you agree to our terms of service and acknowledge you have read our privacy policy.

Not the answer you're looking for? Browse other questions tagged or ask your own question.